This briefing note provides insights into the year-end 2025 Solvency and Financial Condition Reports (SFCRs) of health insurer groups based in the Netherlands,1 together with analysis of selected information included in the Quantitative Reporting Templates (QRTs) published with those SFCRs.2,3 The analysis covers the nine health insurer groups identified below and, where relevant, their underlying solo entities.
This briefing note is intended for insurance and actuarial professionals seeking a market-level view of Dutch health insurers’ publicly disclosed SFCR and QRT information; it is not intended to provide investment, regulatory, or policy advice.
We analysed the SFCRs of all nine health insurer groups based in the Netherlands, including any underlying solo entities, that provide both basic health insurance and supplementary health insurance.4 We have included the following insurer groups in our analysis:
- Achmea Zorgverzekeringen N.V. (Consolidated) (Achmea Health Group)
- Coöperatie VGZ U.A. (VGZ Group)
- CZ Groep (CZ Group)
- Coöperatie Menzis U.A. (Menzis-groep)
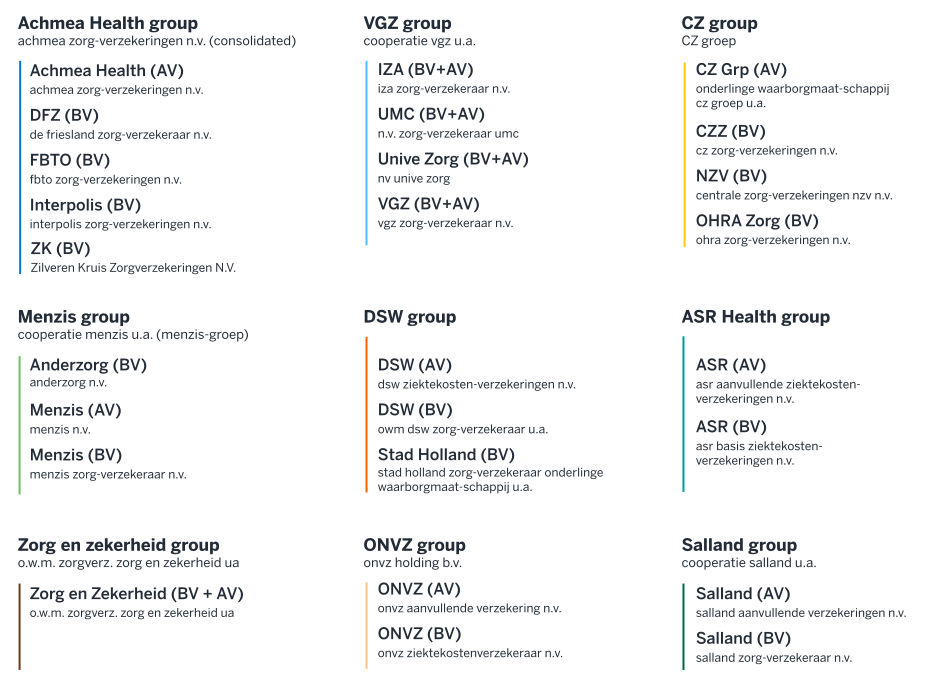
The above insurer groups are based on 26 underlying solo entities that can be traced back to Figure 14 in the Appendix.
In the Netherlands, the health insurance market is characterised by a few dominant insurer groups. The market is primarily led by four major insurer groups: Achmea Health Group, VGZ Group, CZ Group, and Menzis Group. These insurer groups collectively cover most of the Dutch population.
We have also included the remaining insurer groups ONVZ Group and Salland Group and health insurers for DSW, ASR Health, and Zorg en Zekerheid in our analysis to gain a comprehensive view of the entire Dutch health insurance market and to analyse the differences between small and large health insurer groups.
Based on 2025 gross written premiums (GWP), the four largest insurer groups accounted for approximately 86% of the €64.7 billion total GWP included in this analysis. Total Dutch health insurance GWP increased by 5.8% compared with the restated 2024 comparative basis used in this briefing note.
At the insurer group level, all groups recorded an increase in GWP in 2025. ASR Health recorded the strongest growth, with GWP rising by 18%, representing a strong rebound from the prior-year decline of 19%. Salland Group also recorded strong growth, with GWP rising by 12%. Among the other insurers, GWP growth ranged from 2% for Zorg en Zekerheid to approximately 8% for Menzis Group.
Aside from these developments, no other significant changes were observed. The combined market share of the four largest groups decreased slightly, from 86.68% in 2024 to 86.37% in 2025, a decline of approximately 0.3 percentage points.
Figure 1: Reported total gwp at year-end 2025 and year-end 2024 and as percentage of the total Dutch market (figure in € billions)
| INSURER GROUP | GWP 2025 |
GWP 2024 |
CHANGE IN GWP (%) |
MARKET SHARE (%) |
CHANGE IN MARKET SHARE (%) |
|---|---|---|---|---|---|
| Achmea Health Group | 18.53 | 17.66 | 5% | 29% | -0.3% |
| VGZ Group | 15.44 | 14.56 | 6% | 24% | 0.1% |
| CZ Group | 14.18 | 13.59 | 4% | 22% | -0.3% |
| Menzis Group | 7.70 | 7.15 | 8% | 12% | 0.2% |
| DSW8 | 3.11 | 2.91 | 7% | 5% | 0.1% |
| Zorg en Zekerheid | 1.825 | 1.79 | 2% | 3% | -0.1% |
| ASR Health | 1.760 | 1.49 | 18% | 3% | 0.3% |
| ONVZ Group | 1.594 | 1.49 | 7% | 2% | 0.0% |
| Salland Group | 0.53 | 0.47 | 12% | 1% | 0.0% |
| Total | 64.66 | 61.10 | 5.8% | 100% | 0% |
The 2024 comparative figures for DSW have been restated relative to the prior-year briefing note to ensure consistency with the 2025 group-level analysis. DSW now reflects the combined results of OWM DSW Zorgverzekeraar U.A., Stad Holland Zorgverzekeraar OWM U.A., and DSW Ziektekostenverzekeringen N.V. This restatement increases total 2024 GWP from €60.51 billion, as reported in the prior-year briefing note, to €61.10 billion and consequently affects the calculated market shares. As a result, the 2024 comparative figures and related year-on-year comparisons in this briefing note may differ from those published in the 2024 briefing note.
All Dutch health insurer groups offer both compulsory basic health insurance (referred to as BV) and voluntary supplementary health insurance (referred to as AV). In Figure 2, we show the development of the market share in terms of GWP by type of insurance (BV versus AV).9
Figure 2: Market share in terms of GWP by type of insurance
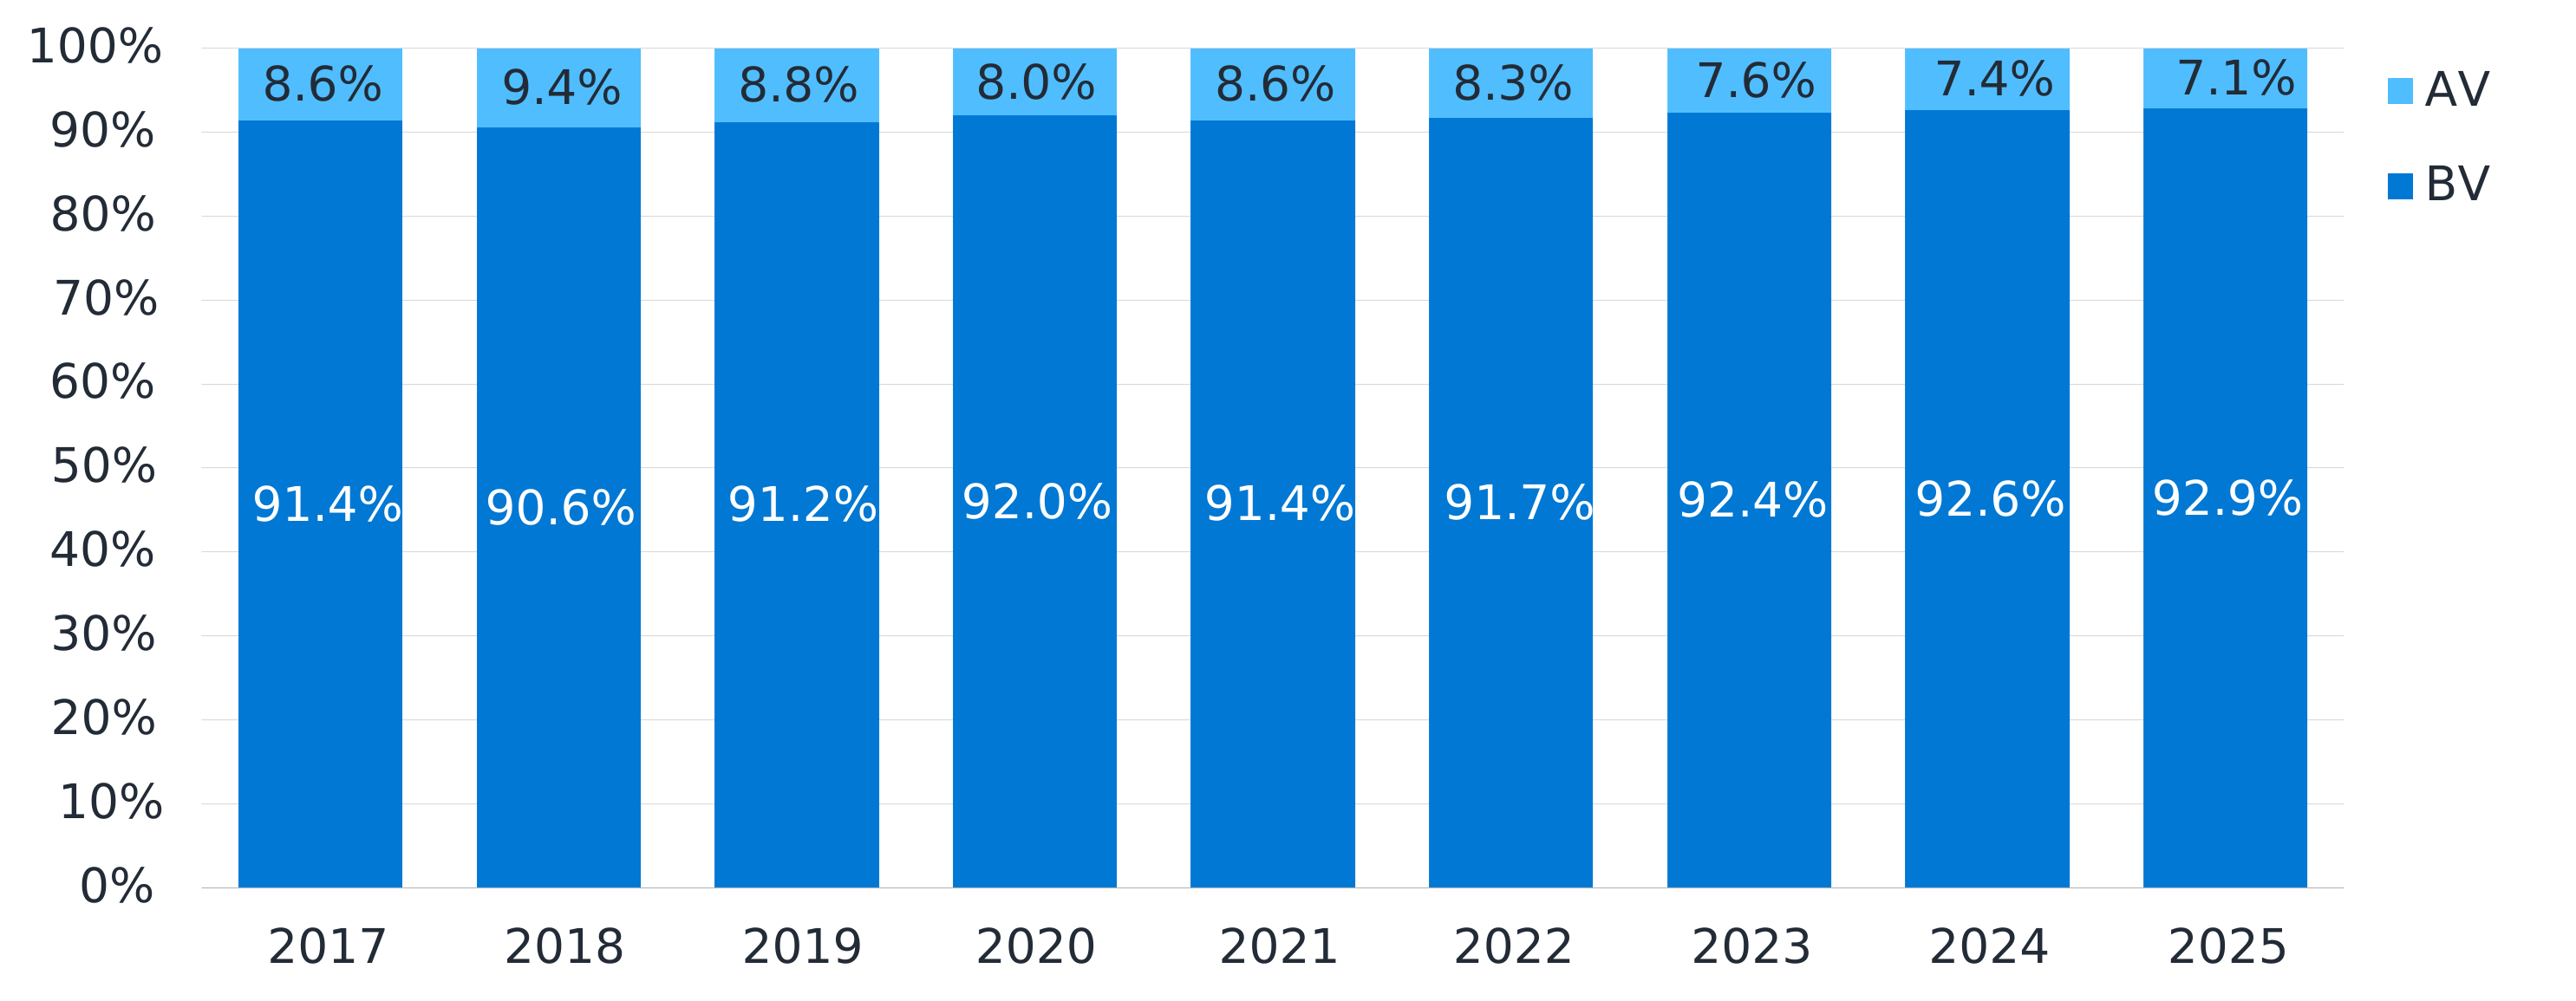
Because basic health insurance is compulsory and covers a broad statutory benefits package, BV represents the large majority of total GWP. In contrast, AV is optional and covers additional services not included in the basic insurance, resulting in a much smaller market share. In addition, the market share of basic health insurance increased slightly over time, from 91.4% in 2017 up to 92.9% in 2025.
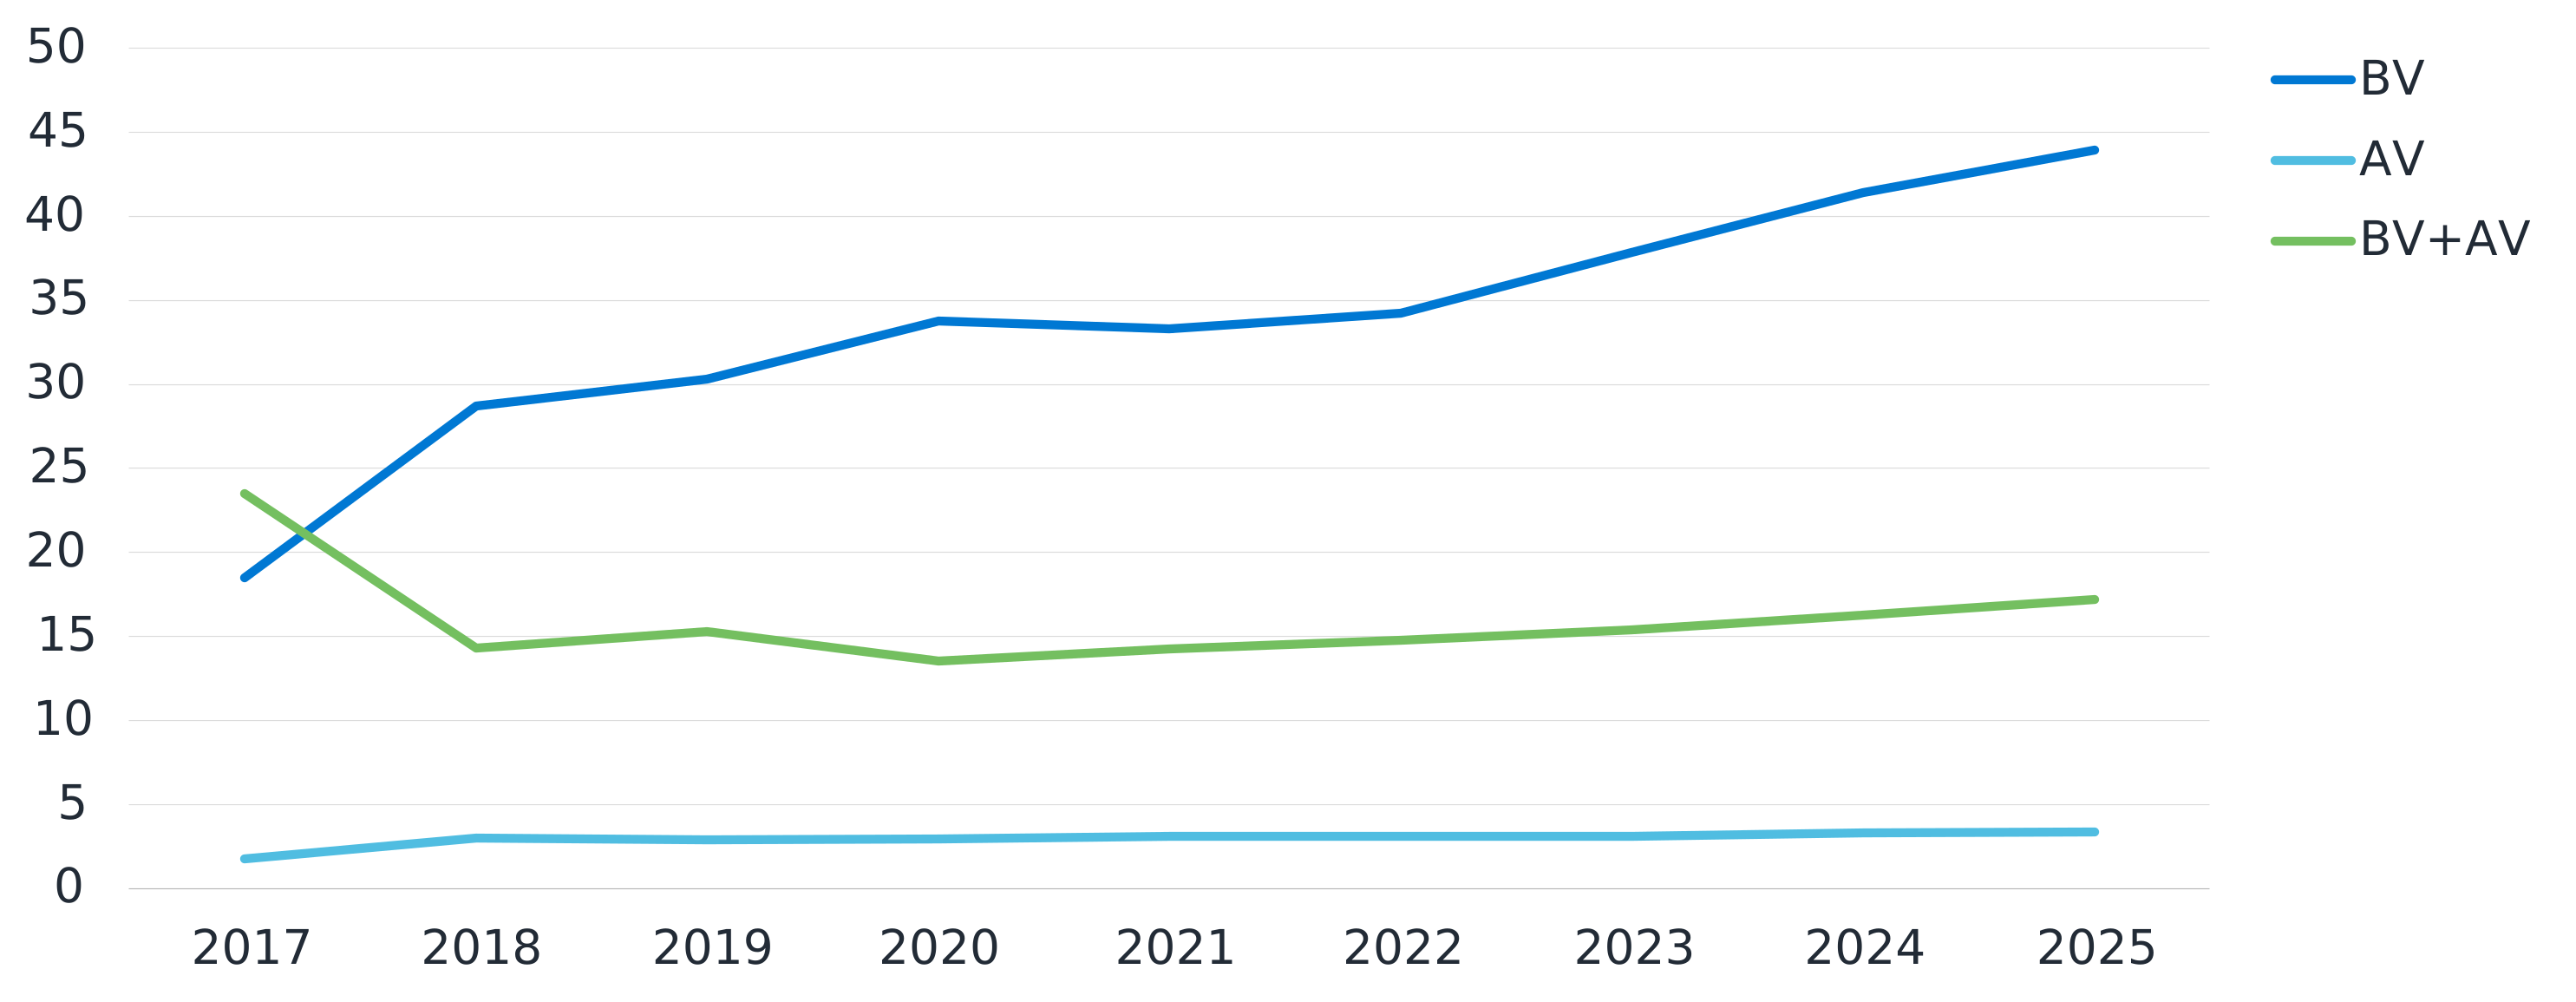
Figure 3 shows this increase is due to the relatively steady increase in GWP for BV, while the GWP for AV has remained stable over the years. An important reason for this change might be the decline over time in the number of insured people taking out supplementary insurance.10 Between 2017 and 2018, a legal restructuring took place within the Achmea Health Group, which resulted in a temporary decrease in GWP for solo entities that only offer BV or AV and an increase in GWP for solo entities that offer BV+AV.
Figure 3: GWP per insurance type (figure in € billions)11
Combined ratio
Figures 4 and 5 show the evolution of the combined ratio for all health insurer groups in the Netherlands since 2017. In this paper, the combined ratio is defined as (net claims incurred + change in technical provisions + expenses) divided by net earned premiums. Compared to non-life insurers, combined ratios for Dutch health insurer groups have remained relatively stable over time, generally fluctuating within a relatively narrow range around 100%. This stability reflects several characteristics of the Dutch basic health insurance system, including the risk-equalisation scheme, strong competition, and annual premium setting. Together, these features contribute to a system in which premiums and risk-equalisation contributions are intended to broadly cover healthcare and operating costs over time.
Figure 4: Evolution of the combined ratio for the four largest health insurer groups and the market
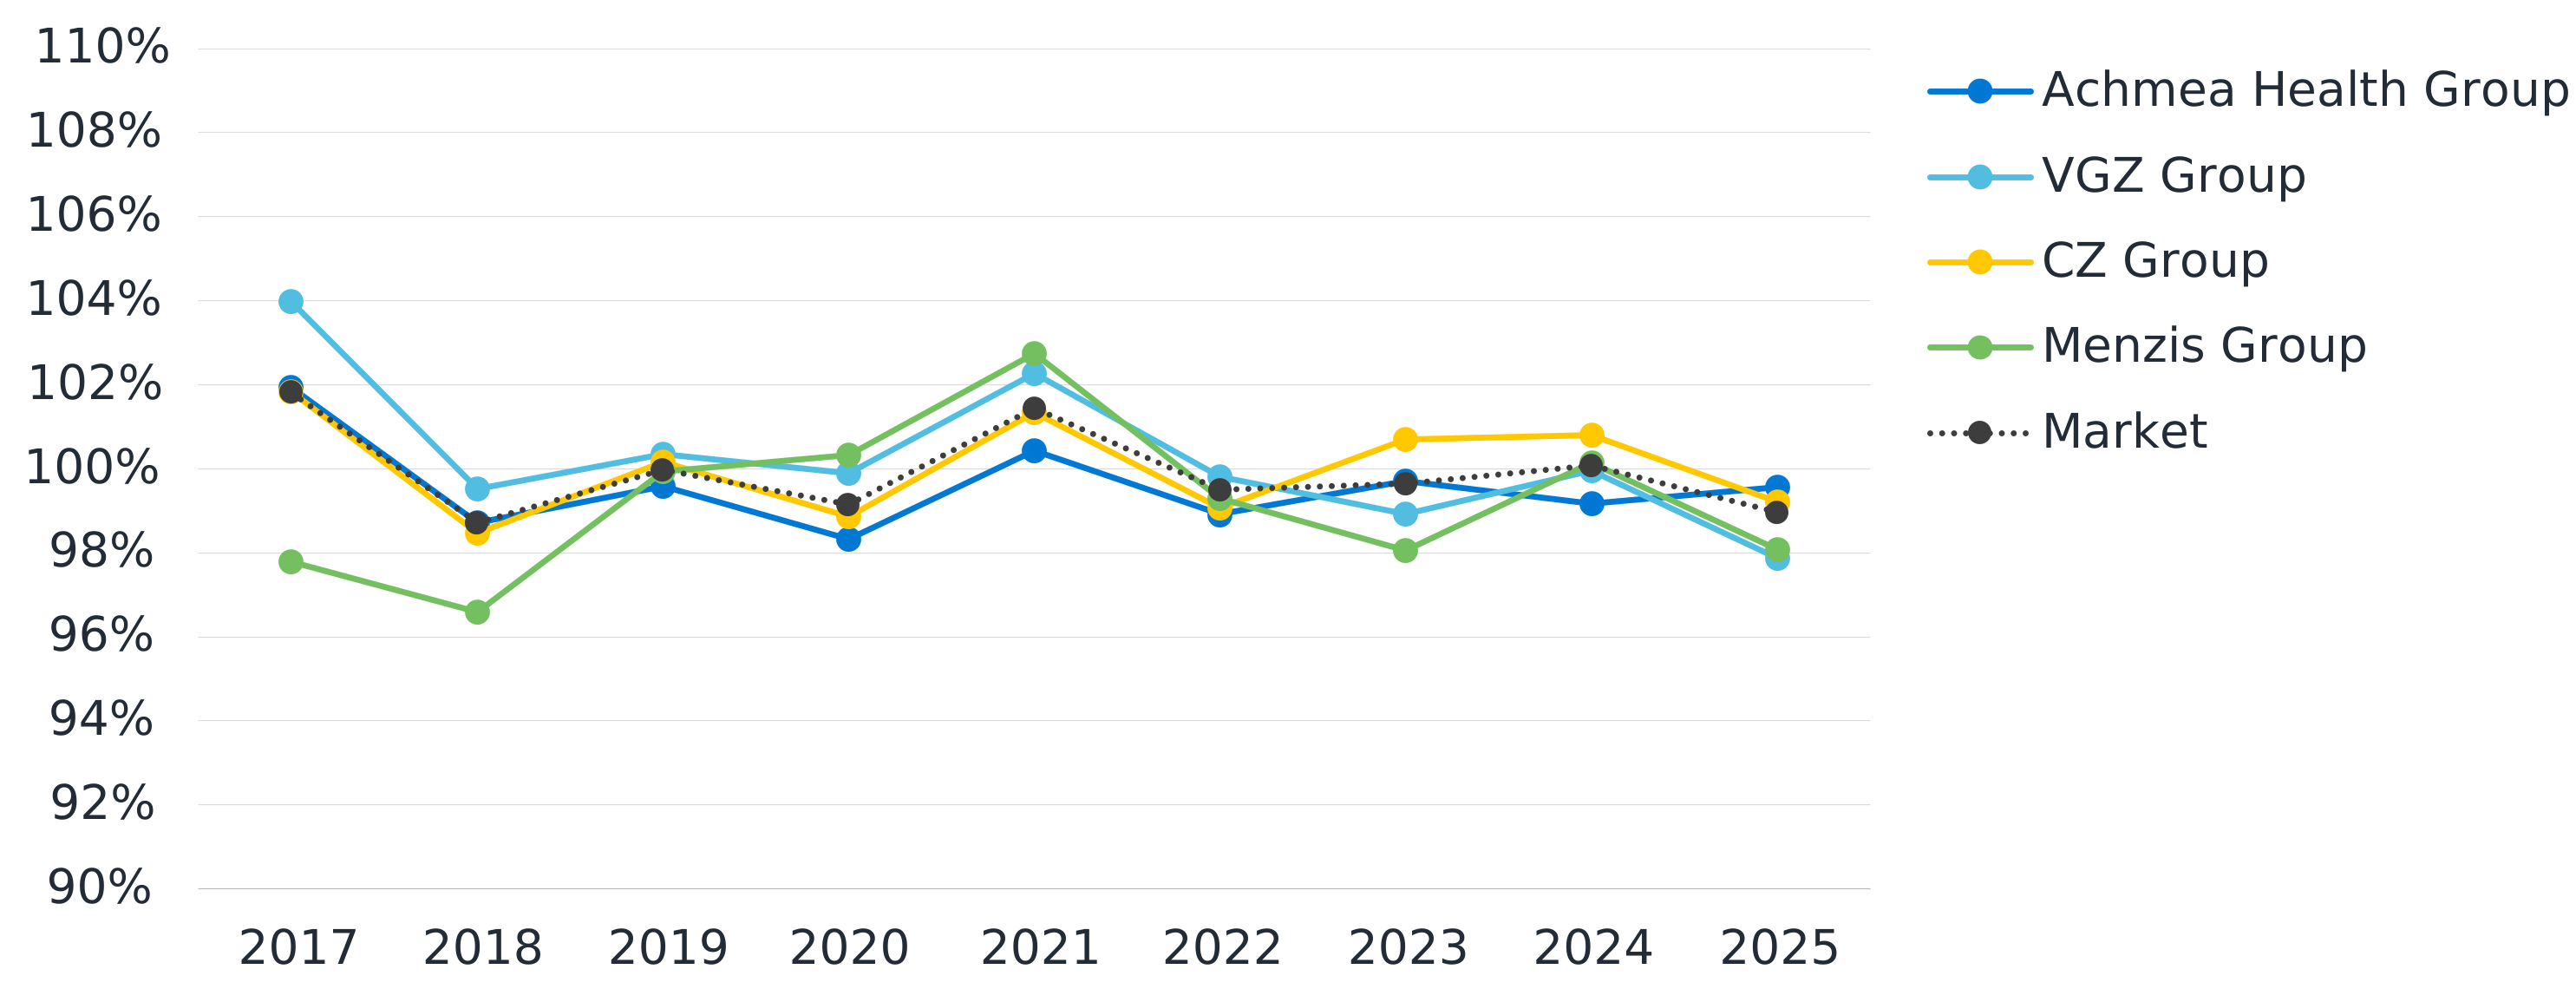
Figure 5: Evolution of the combined ratio for the five smallest health insurer groups
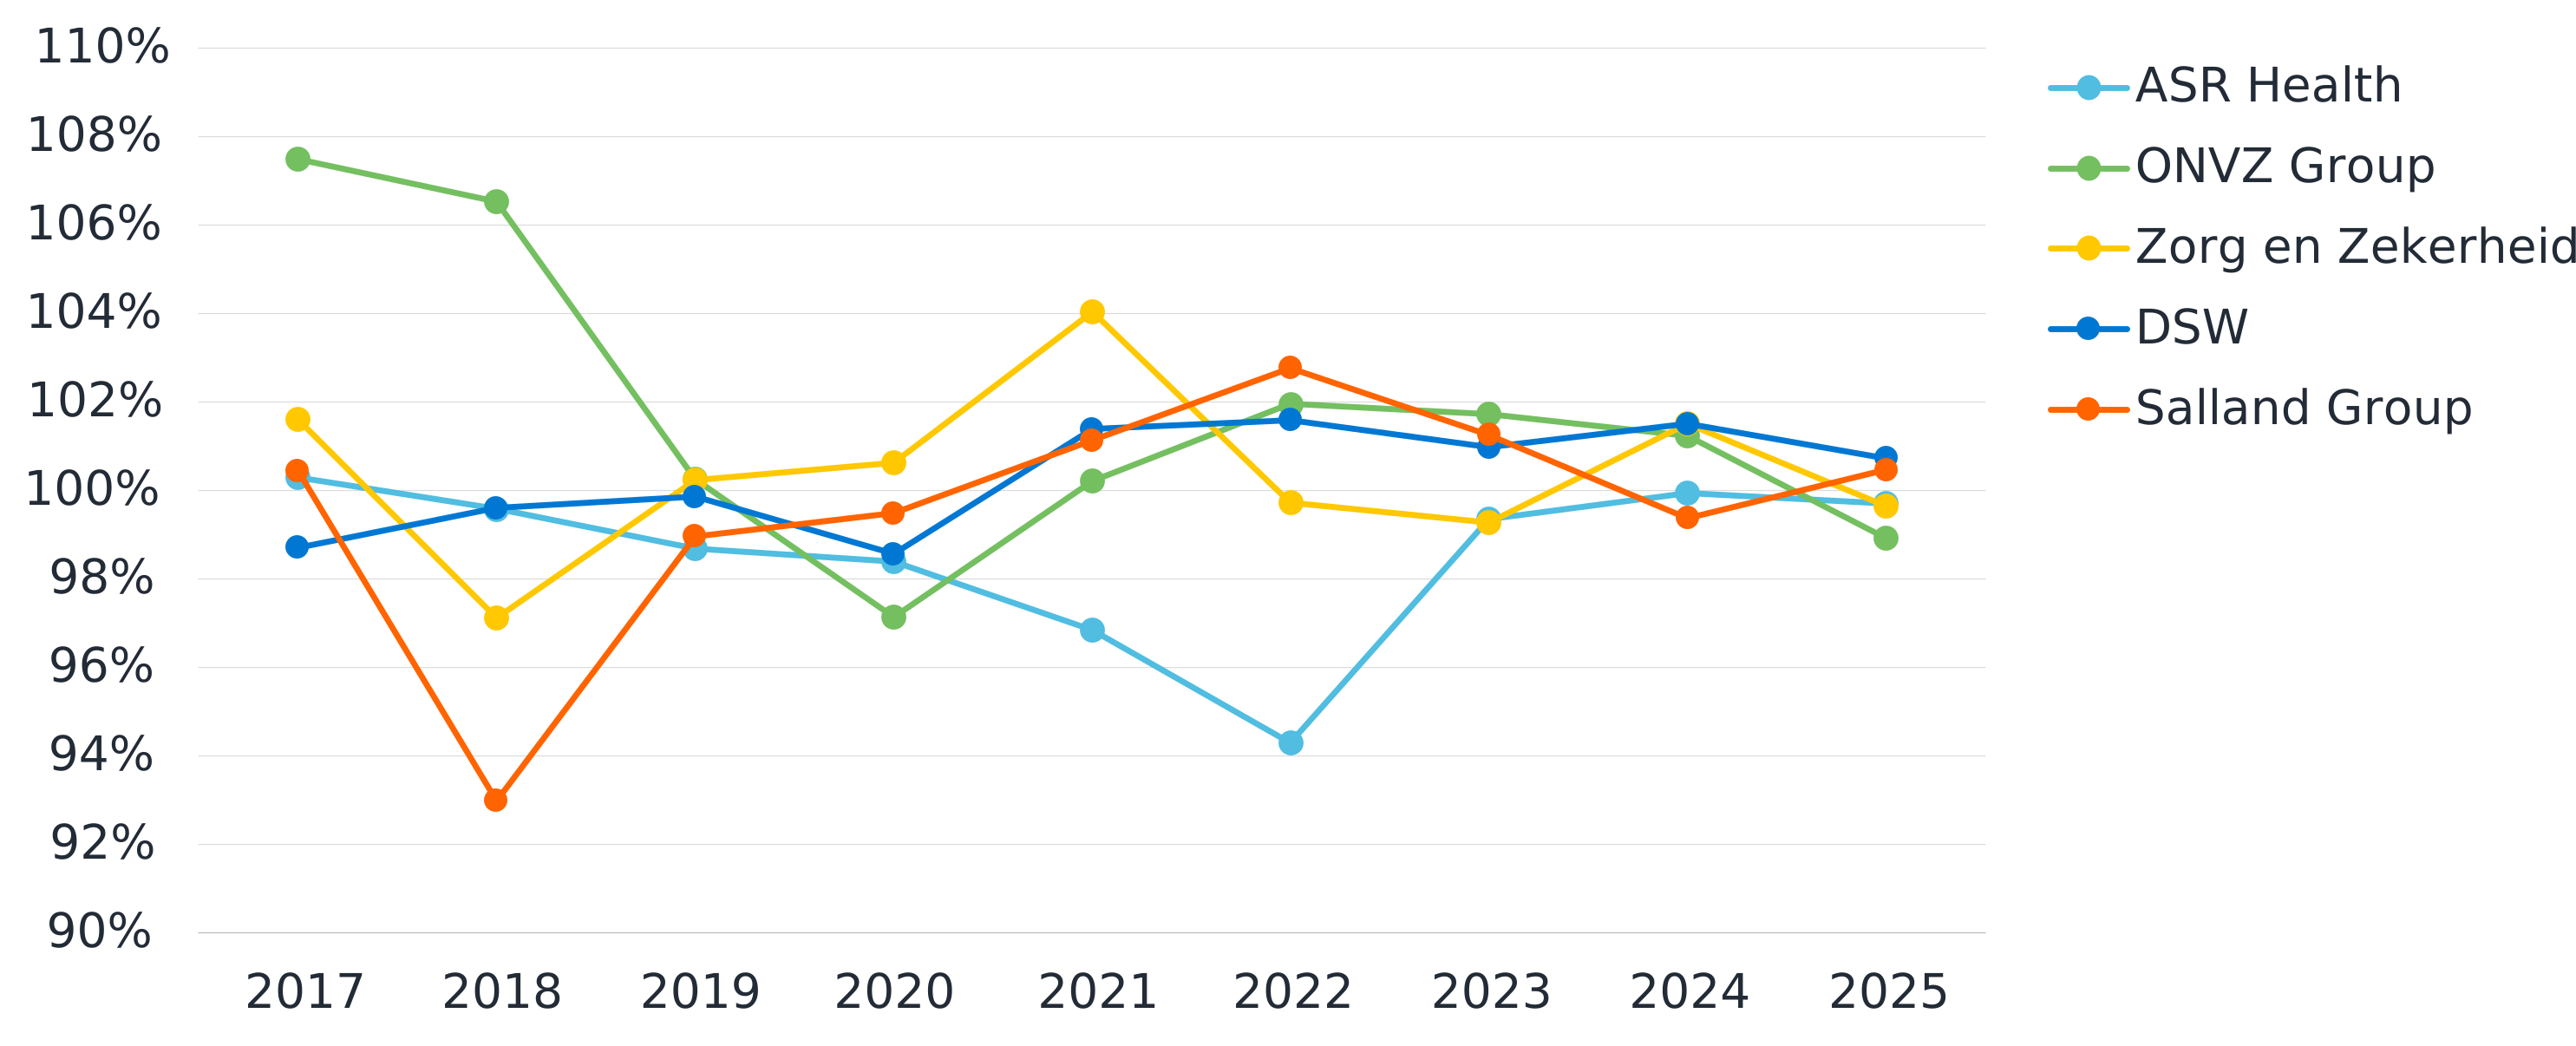
In 2025, the market combined ratio decreased by 1.1 percentage points to 99%. Most insurer groups also reported lower combined ratios than in 2024, with the largest decreases for ONVZ Group (-2.3 percentage points), VGZ Group (-2.1 percentage points), and Menzis Group (-2.1 percentage points), while Achmea Health Group (+0.4 percentage points) and Salland Group (+1.1 percentage points) reported increases. Combined ratios across insurer groups ranged from 97.9% for VGZ Group to 100.7% for DSW.
Over the longer period, the smaller insurer groups have generally shown somewhat greater volatility than the four largest groups, particularly in the earlier years. This may partly reflect remaining imperfections in the Dutch risk-equalisation model, which can have a relatively greater impact on smaller insured populations. Larger insurers benefit from a larger insured population, reducing the impact of individual deviations from the assumptions underlying the risk-equalisation model. For smaller insurers, annual policyholder churn can result in more pronounced changes in the risk profile, making underwriting results more sensitive to any remaining under- or overcompensation. In addition, portfolio contraction can have a relatively larger impact on the expense ratio of smaller insurers, as a largely fixed cost base is spread over fewer policyholders. In the most recent three years, however, the combined ratios of both larger and smaller insurer groups have shown relatively low and comparable volatility.
One possible explanation for this convergence is the continued refinement of the Dutch risk-equalisation scheme. In 2023, a bandwidth arrangement for variable healthcare costs was applied, under which insurers’ gains and losses beyond a predefined threshold were partially compensated. In 2024, high-cost compensation was introduced, redistributing part of the costs of exceptionally high-cost individuals across the insurers. By limiting insurers’ exposure to individual outliers, this mechanism may particularly benefit smaller insurers, whose portfolios are more sensitive to such shocks. Constrained regression was also introduced in 2024 to reduce predictable undercompensation for groups with chronic conditions. In 2025, the model was further refined, including adjustments to the compensation for high-cost and chronically ill insureds, pregnancy-related costs, characteristics related to long-term care under the Dutch Long-term Care Act (Wet langdurige zorg; Wlz) and non-residents. The high-cost compensation threshold was also indexed.12 Collectively, these changes may have contributed to lower volatility in insurers’ underwriting results, particularly for smaller insurers. The extent to which these changes explain observed volatility is not separately quantified in this analysis.
SCR coverage ratio
Figure 6 illustrates the Solvency Capital Requirement (SCR) coverage ratio for each insurer group and the total health insurance market over the past three years.
Figure 6: SCR coverage ratio of the health insurer groups
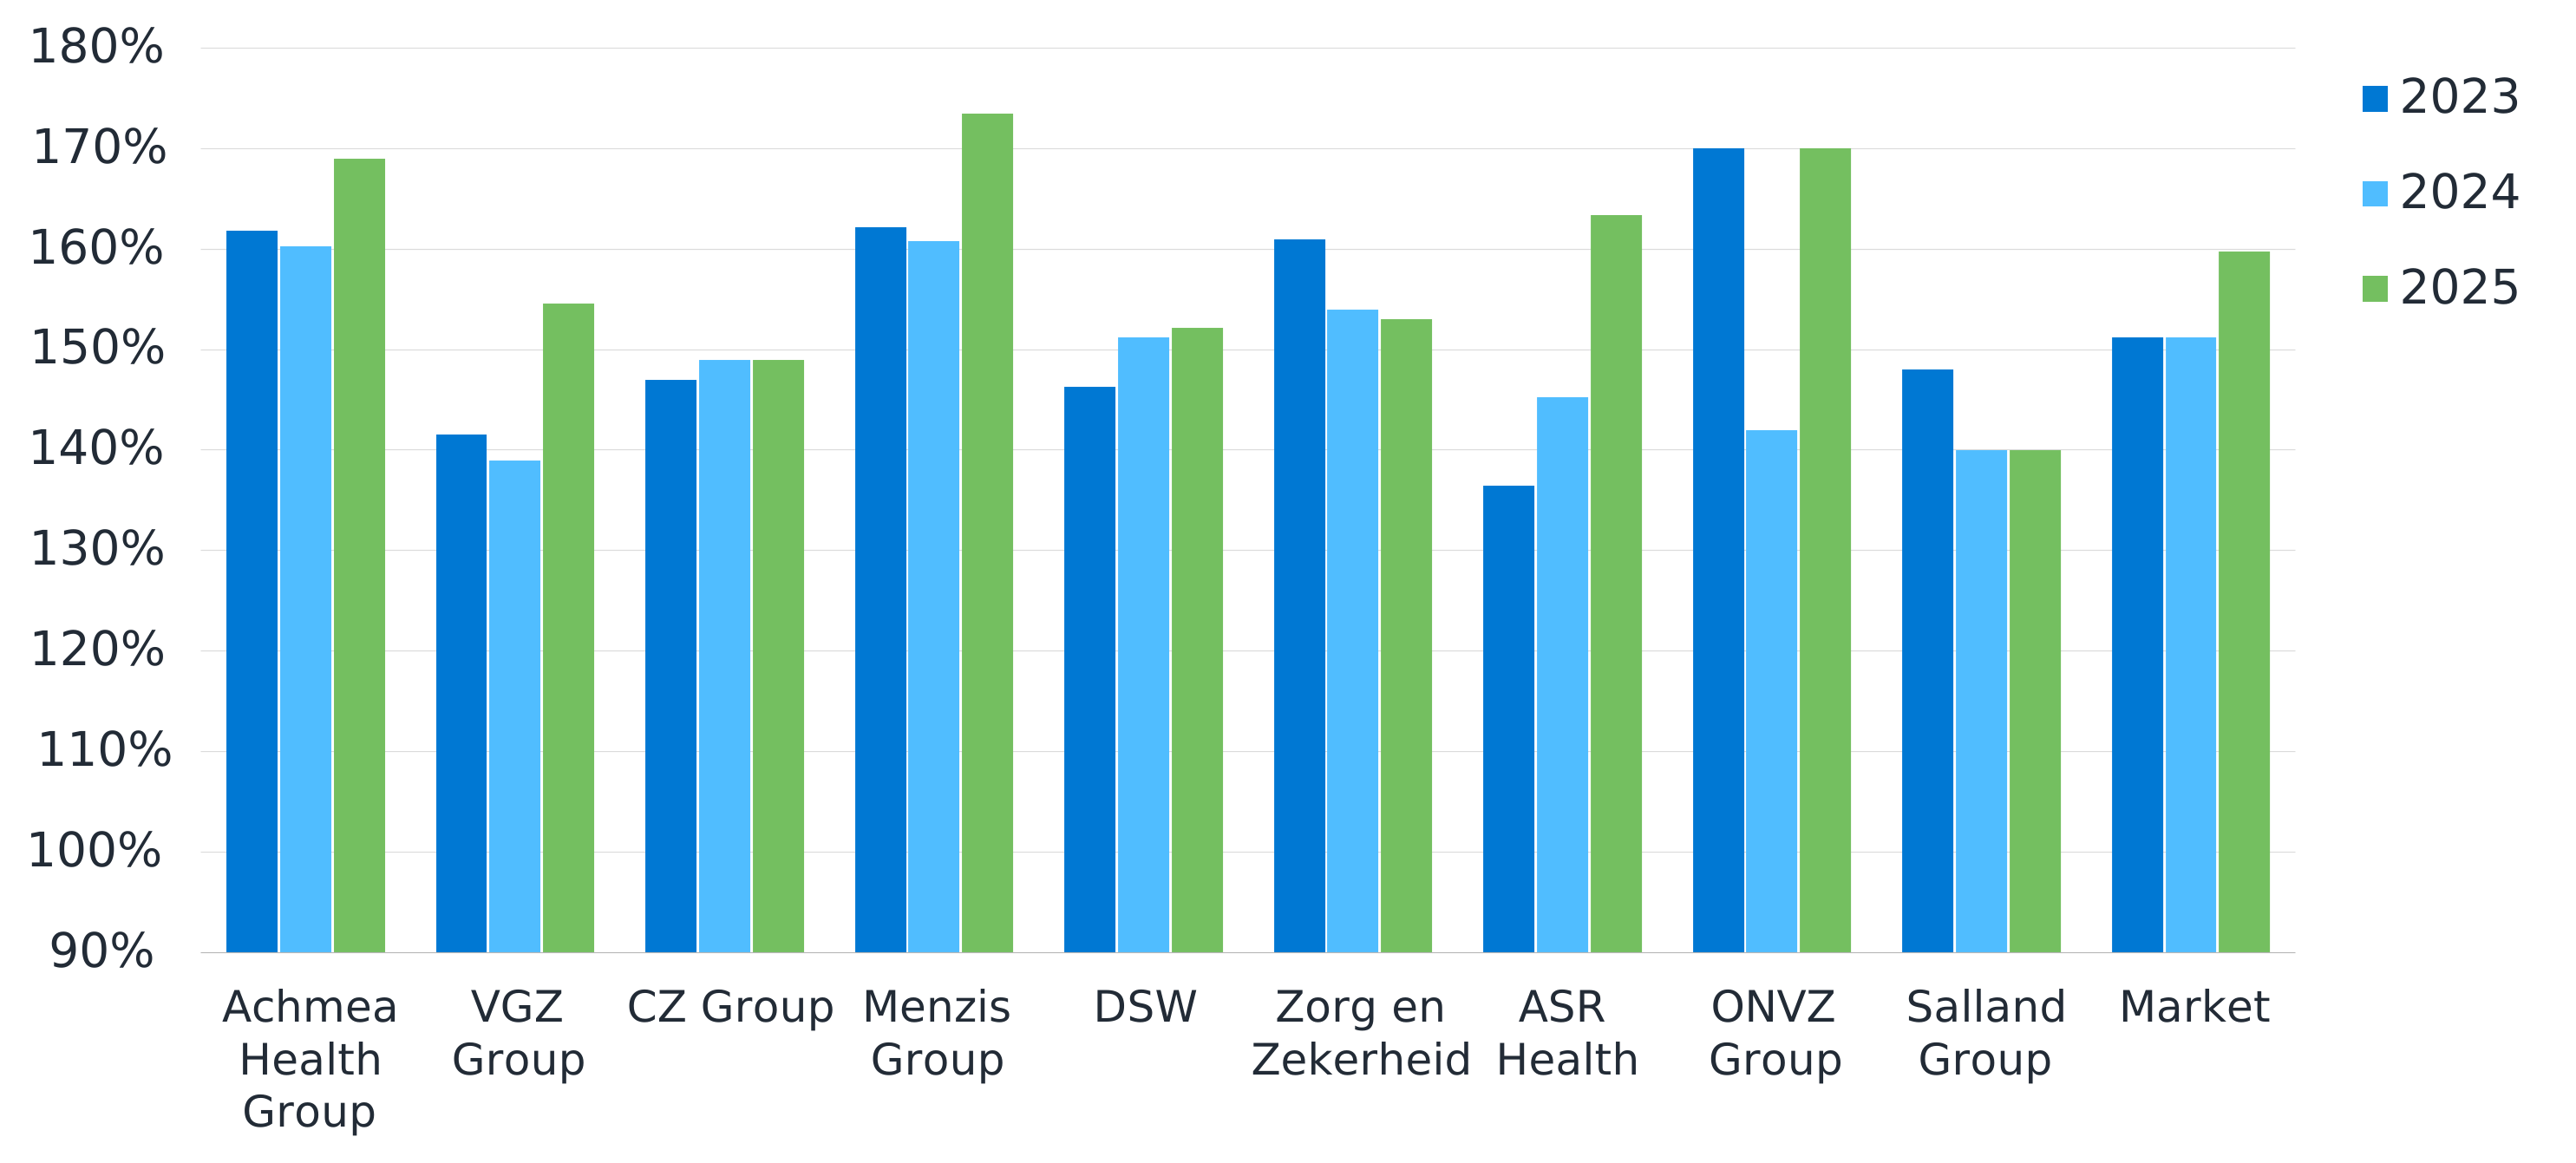
The market-weighted average SCR coverage ratio remained broadly stable in 2024 at 151%, before increasing to 160% in 2025, indicating an overall strengthening of solvency positions. Most insurer groups reported higher SCR coverage ratios in 2025, with the largest increases observed for ONVZ Group (+28 percentage points), ASR Health (+18 percentage points), and VGZ Group (+16 percentage points). Zorg en Zekerheid was the only group to report a slight decline (-1 percentage point).
Despite these year-on-year movements, SCR coverage ratios have remained relatively stable for most health insurer groups over the three-year period. Compared with life and non-life insurers, volatility in the health insurance sector remains relatively low.
The market-weighted average SCR coverage ratio is largely driven by the BV business, which represents the vast majority of health insurance premium volume. An important characteristic of the Dutch basic health insurance system under the Health Insurance Act (Zvw) is the close interaction between premium setting and capital management. The Dutch regulator has established principles requiring health insurers to align their premium and capital management policies.13 As premiums are set annually, insurers can use premium adjustments to manage their solvency position towards their internal target ratio. This mechanism may help explain the relatively stable SCR coverage ratios observed for BV and, given its dominant share of the market, for the health insurance sector overall.
Figure 7 shows the development of the market-weighted average SCR coverage ratios for basic (BV) and supplementary (AV) health insurance in the Netherlands. The ratios are based on the reported own funds and SCRs of solo entities offering exclusively BV or AV business in the respective reporting years.14
Figure 7: SCR coverage ratio for BV and AV health insurance15
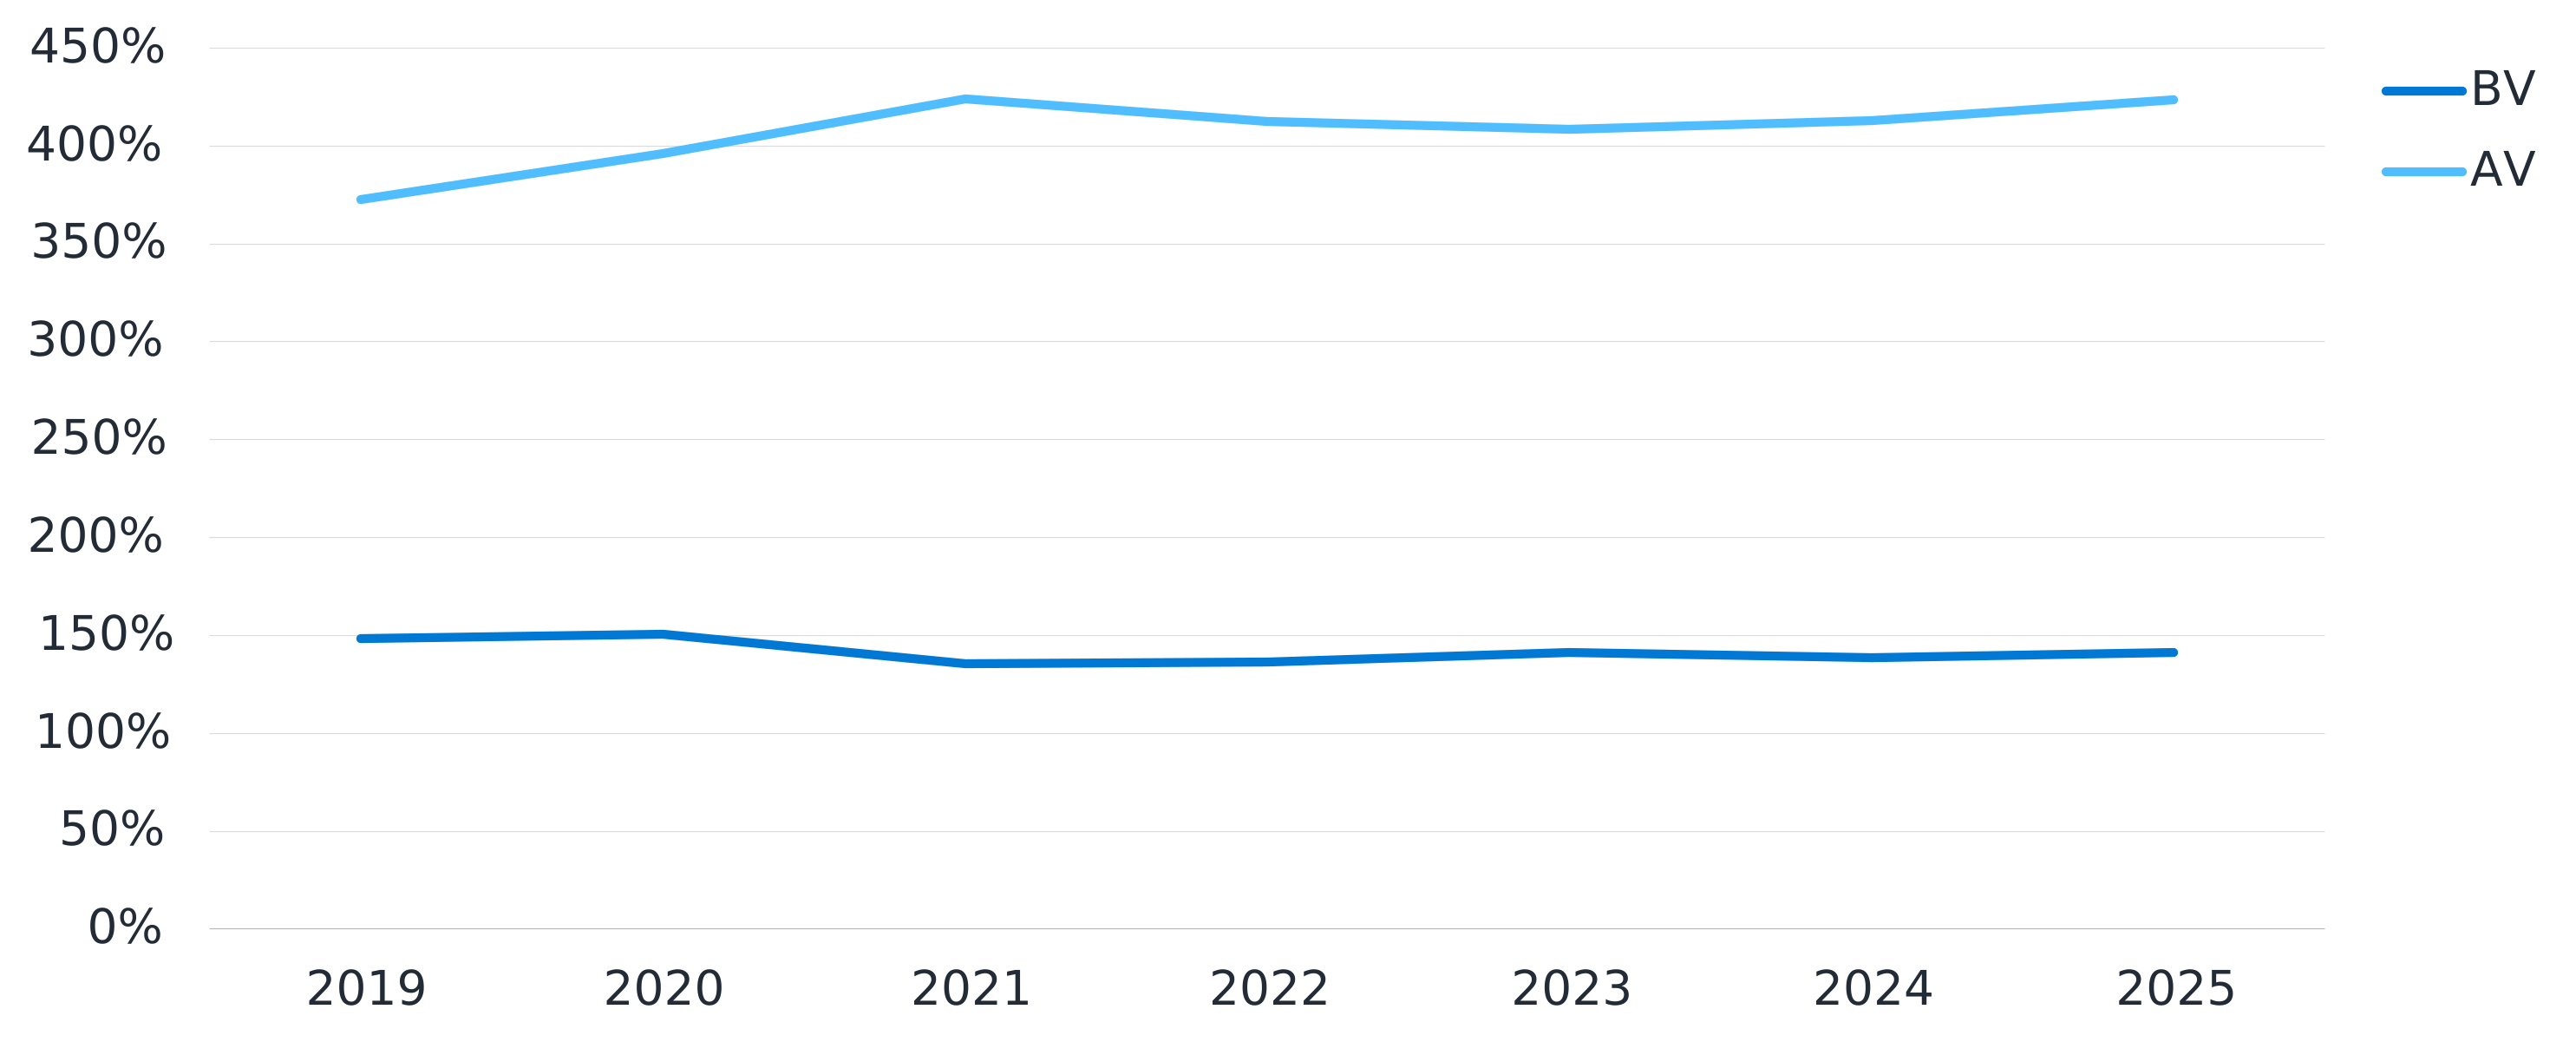
Figure 7 shows a clear and persistent difference in the development of SCR coverage ratios between the two types of health insurance business. The BV coverage ratio has remained relatively stable at around 140% in recent years, while the AV ratio has shown greater fluctuations at substantially higher levels. In 2025, the BV ratio remained broadly stable at around 140%, whereas the AV ratio increased from 413% to 424%.
SCR standard formula
The SCR under the standard formula for Dutch health insurer groups as of 31 December 2025 is primarily driven by health underwriting risk, which accounts for 71% of the total SCR, reflecting the sector’s core insurance activities. Market risk and counterparty default risk account for 20% and 4%, respectively. Operational risk represents 20% of the total SCR. Under the standard formula, operational risk is largely volume-driven and therefore does not directly vary with insurer-specific operational risk management effectiveness. Diversification reduces the aggregate SCR by 15%, while other adjustments, including the loss-absorbing capacity of deferred taxes (LACDT), are negligible at market level.
Figure 8: SCR breakdown for the Dutch health insurance market at year-end 2025
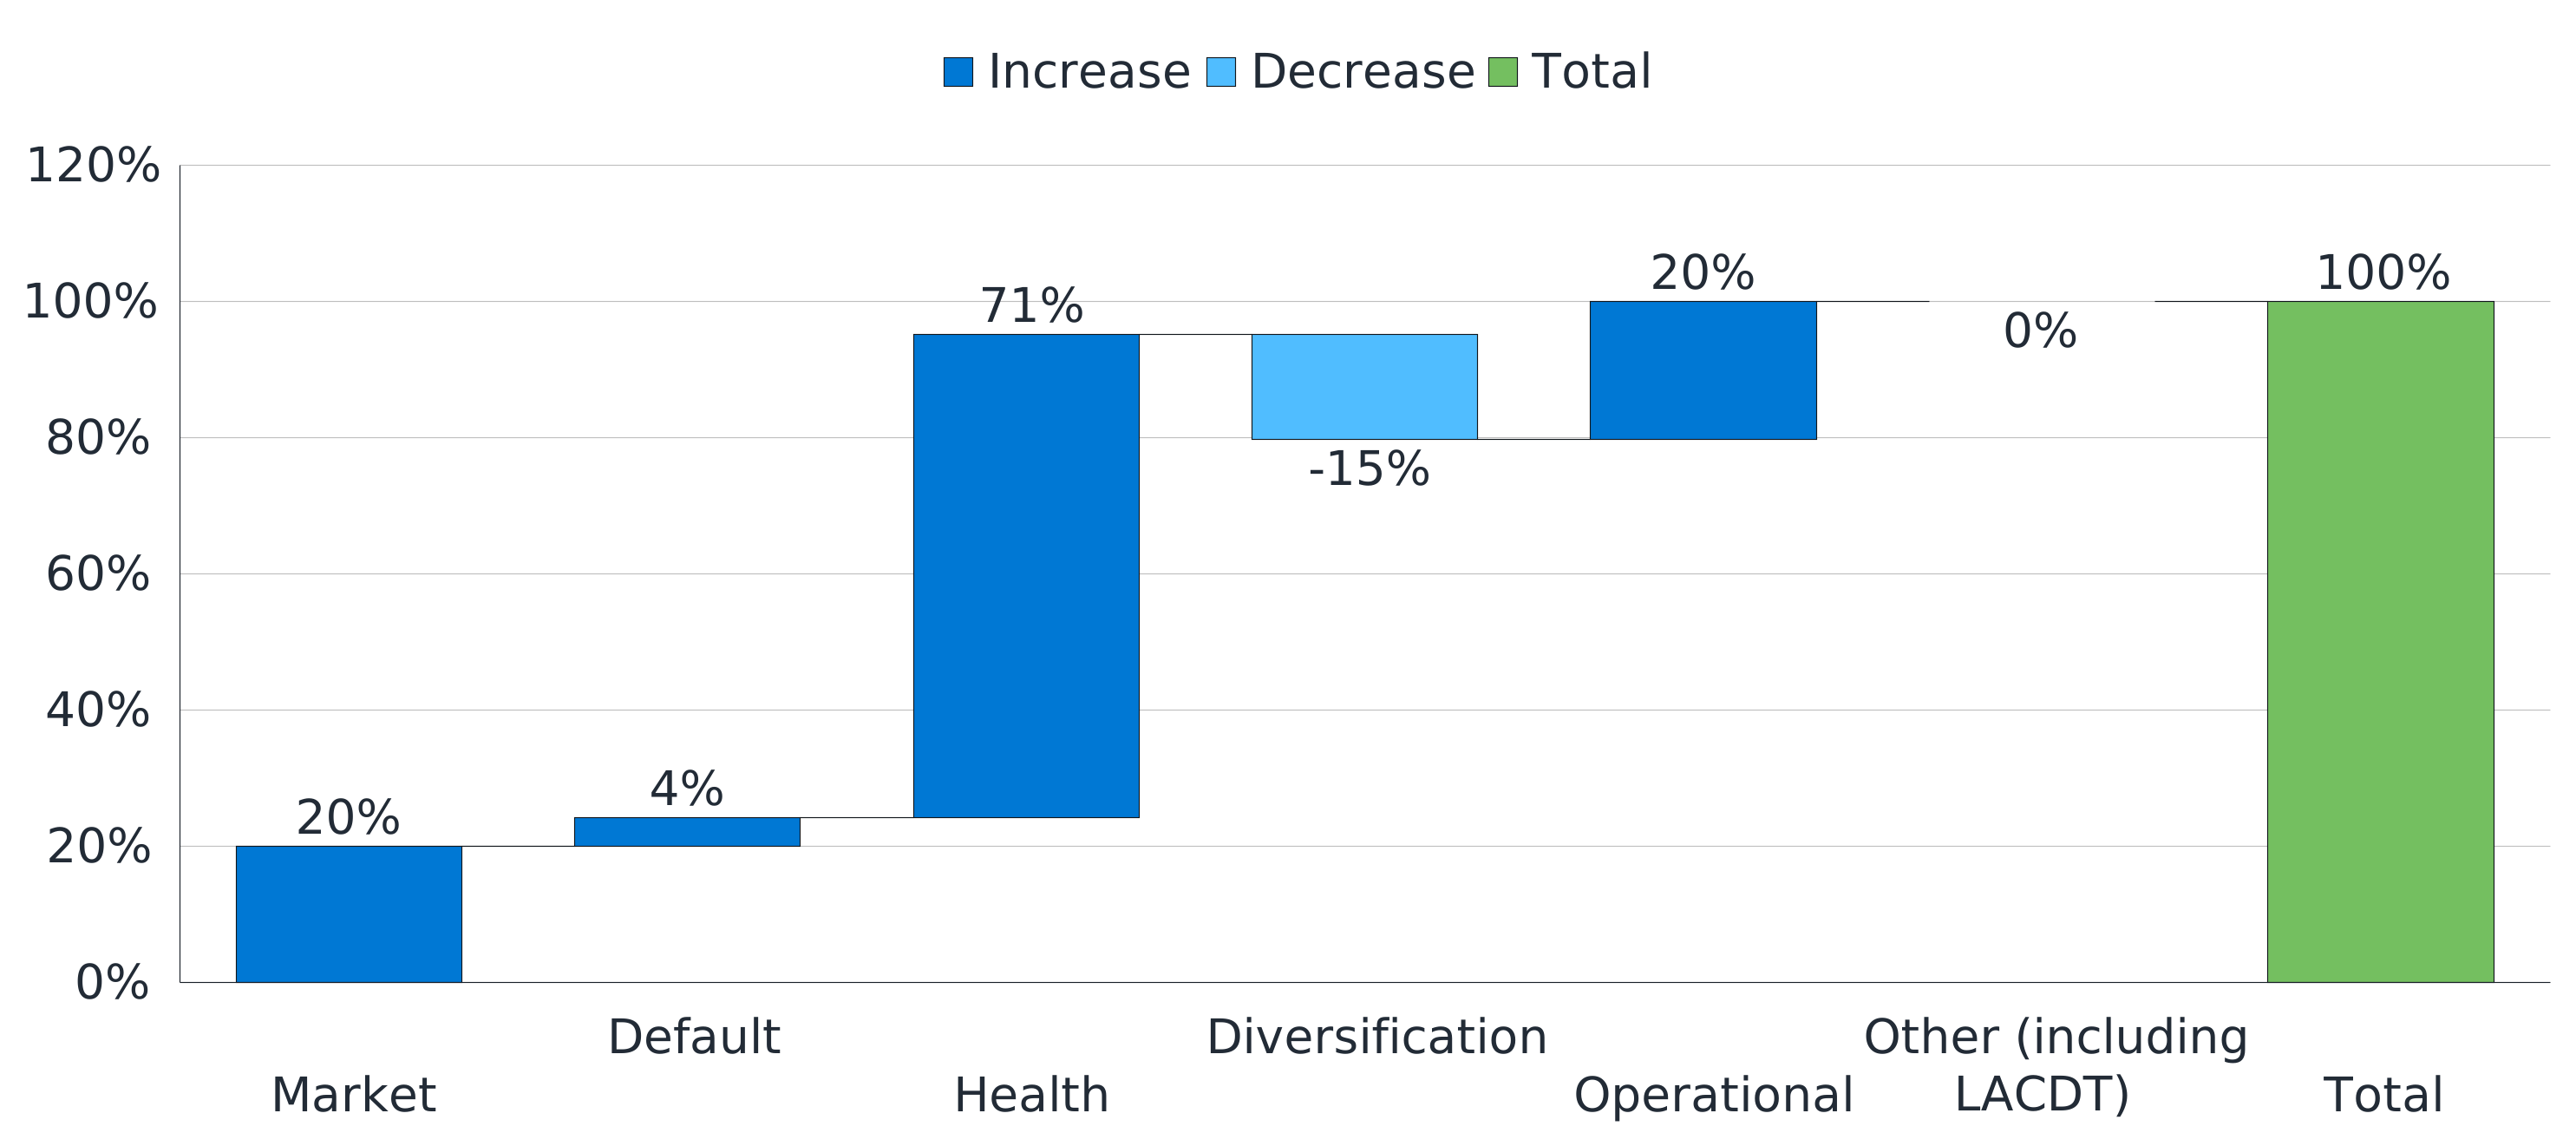
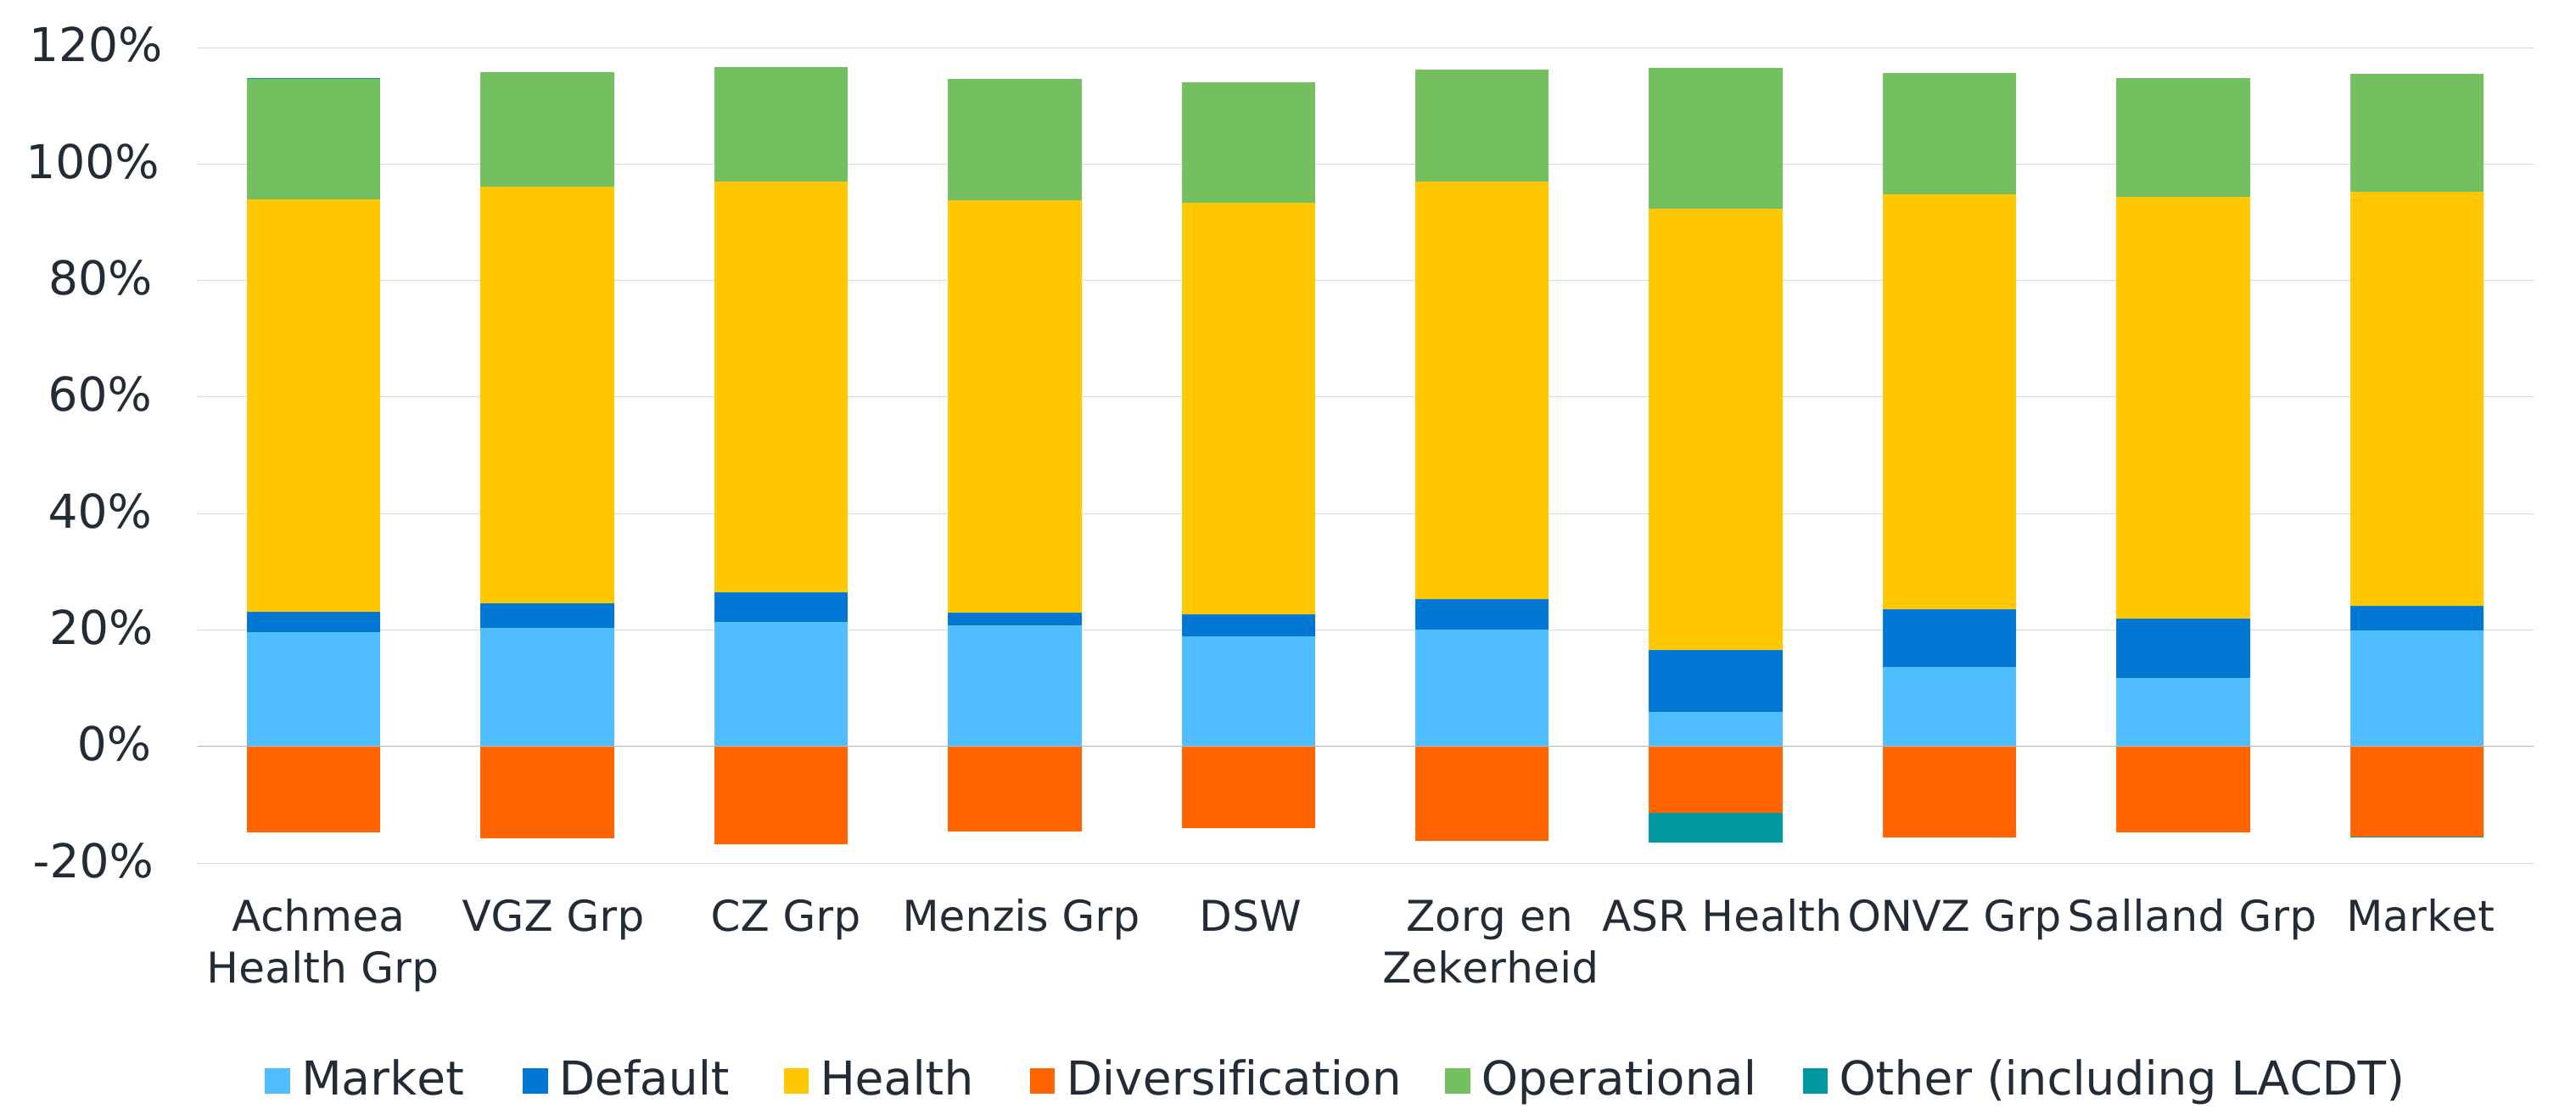
Figure 9 compares the SCR composition across individual health insurer groups at year-end 2025. Most insurers have risk profiles broadly aligned with the market, although several differences stand out. ASR Health has a distinct risk profile, with a higher share of health underwriting risk (76% versus 71% for the market), substantially lower market risk (6% versus 20%), and a somewhat lower diversification benefit (-11% versus -15%). This pattern has remained broadly consistent from 2022 to 2025. ASR Health is also the only group to recognise LACDT, amounting to -5% in 2025. Counterparty default risk is notably higher for ASR Health (11%), ONVZ Group (10%), and Salland Group (10%) than for the market overall (4%). The remaining groups are broadly aligned with the market profile.
Figure 9: SCR breakdown per health insurer group at year-end 2025
Assets
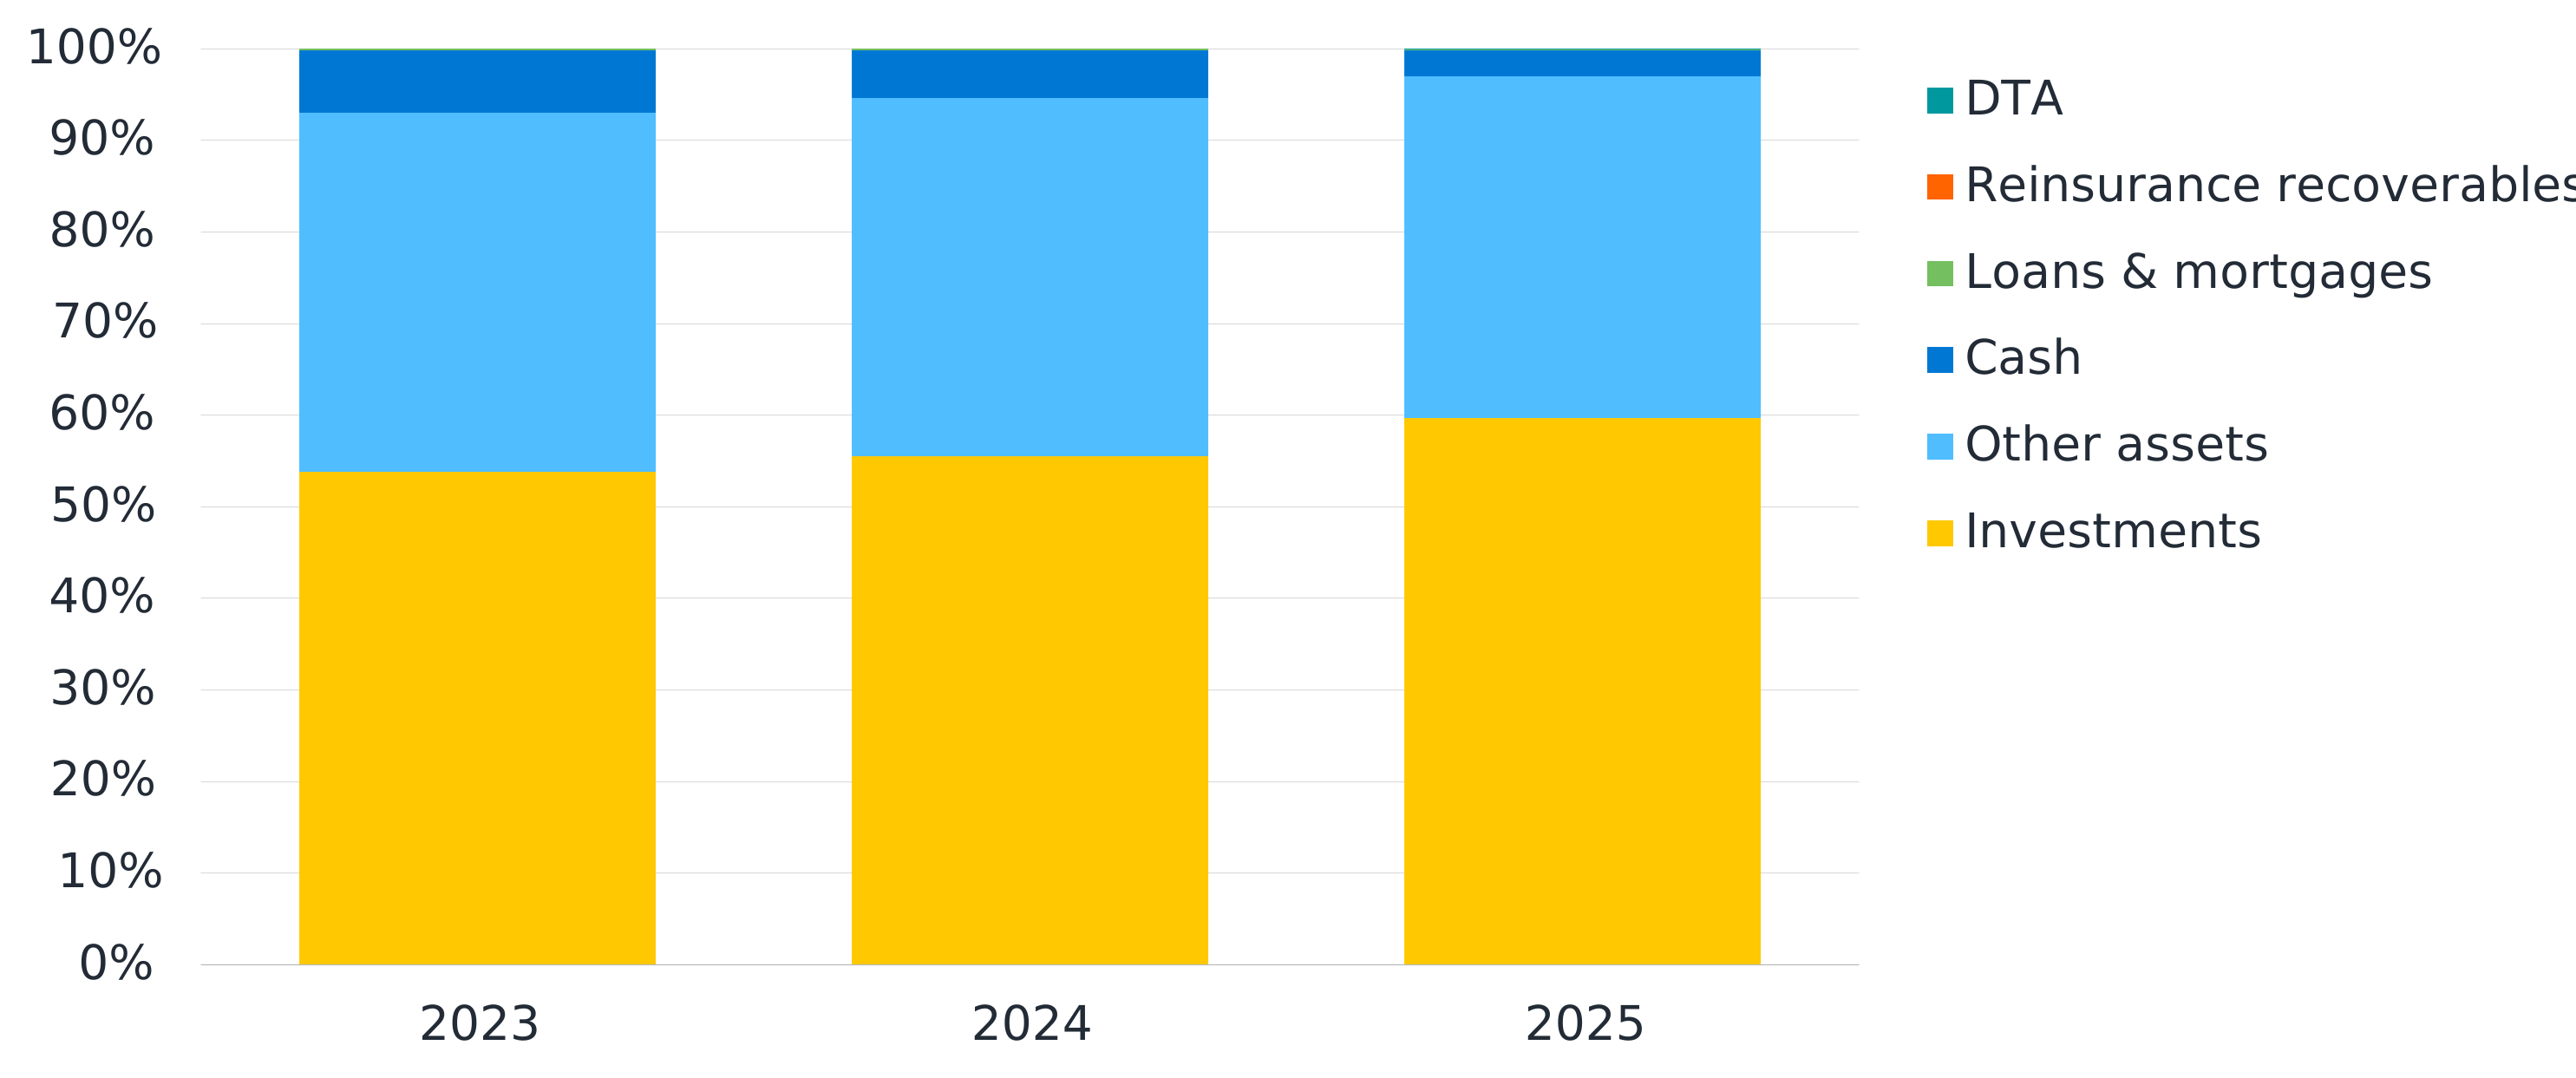
Investments accounted for around 60% of total assets in the Dutch health insurance market in 2025, with other assets accounting for most of the remainder. Overall, the market-level asset allocation has remained relatively stable over the past three years. In 2025, the share of investments increased further to 59.7%, while cash holdings decreased, continuing the gradual shift observed over the period.
Figure 10: Asset allocation of the Dutch health insurance market from 2023 to 2025
At group level, investments were the largest asset category for all health insurers in 2025, although their share of total assets varied from 52% for Salland Group to 73% for ONVZ Group. Cash positions were relatively limited for most insurers. Salland Group (19%) and Zorg en Zekerheid (12%) were notable exceptions, compared with a market average of 3%, while Achmea Health Group and CZ Group reported the lowest cash allocation, both at 0.7%. ASR Health also stood out with a negative reinsurance recoverables position of 2.2% of total assets, a balance sheet item that had not been reported by ASR Health in previous years. Investments and other assets remained the two dominant asset categories across all insurer groups, as shown in Figure 11.
Figure 11: Asset allocation by health insurer group at year-end 2025
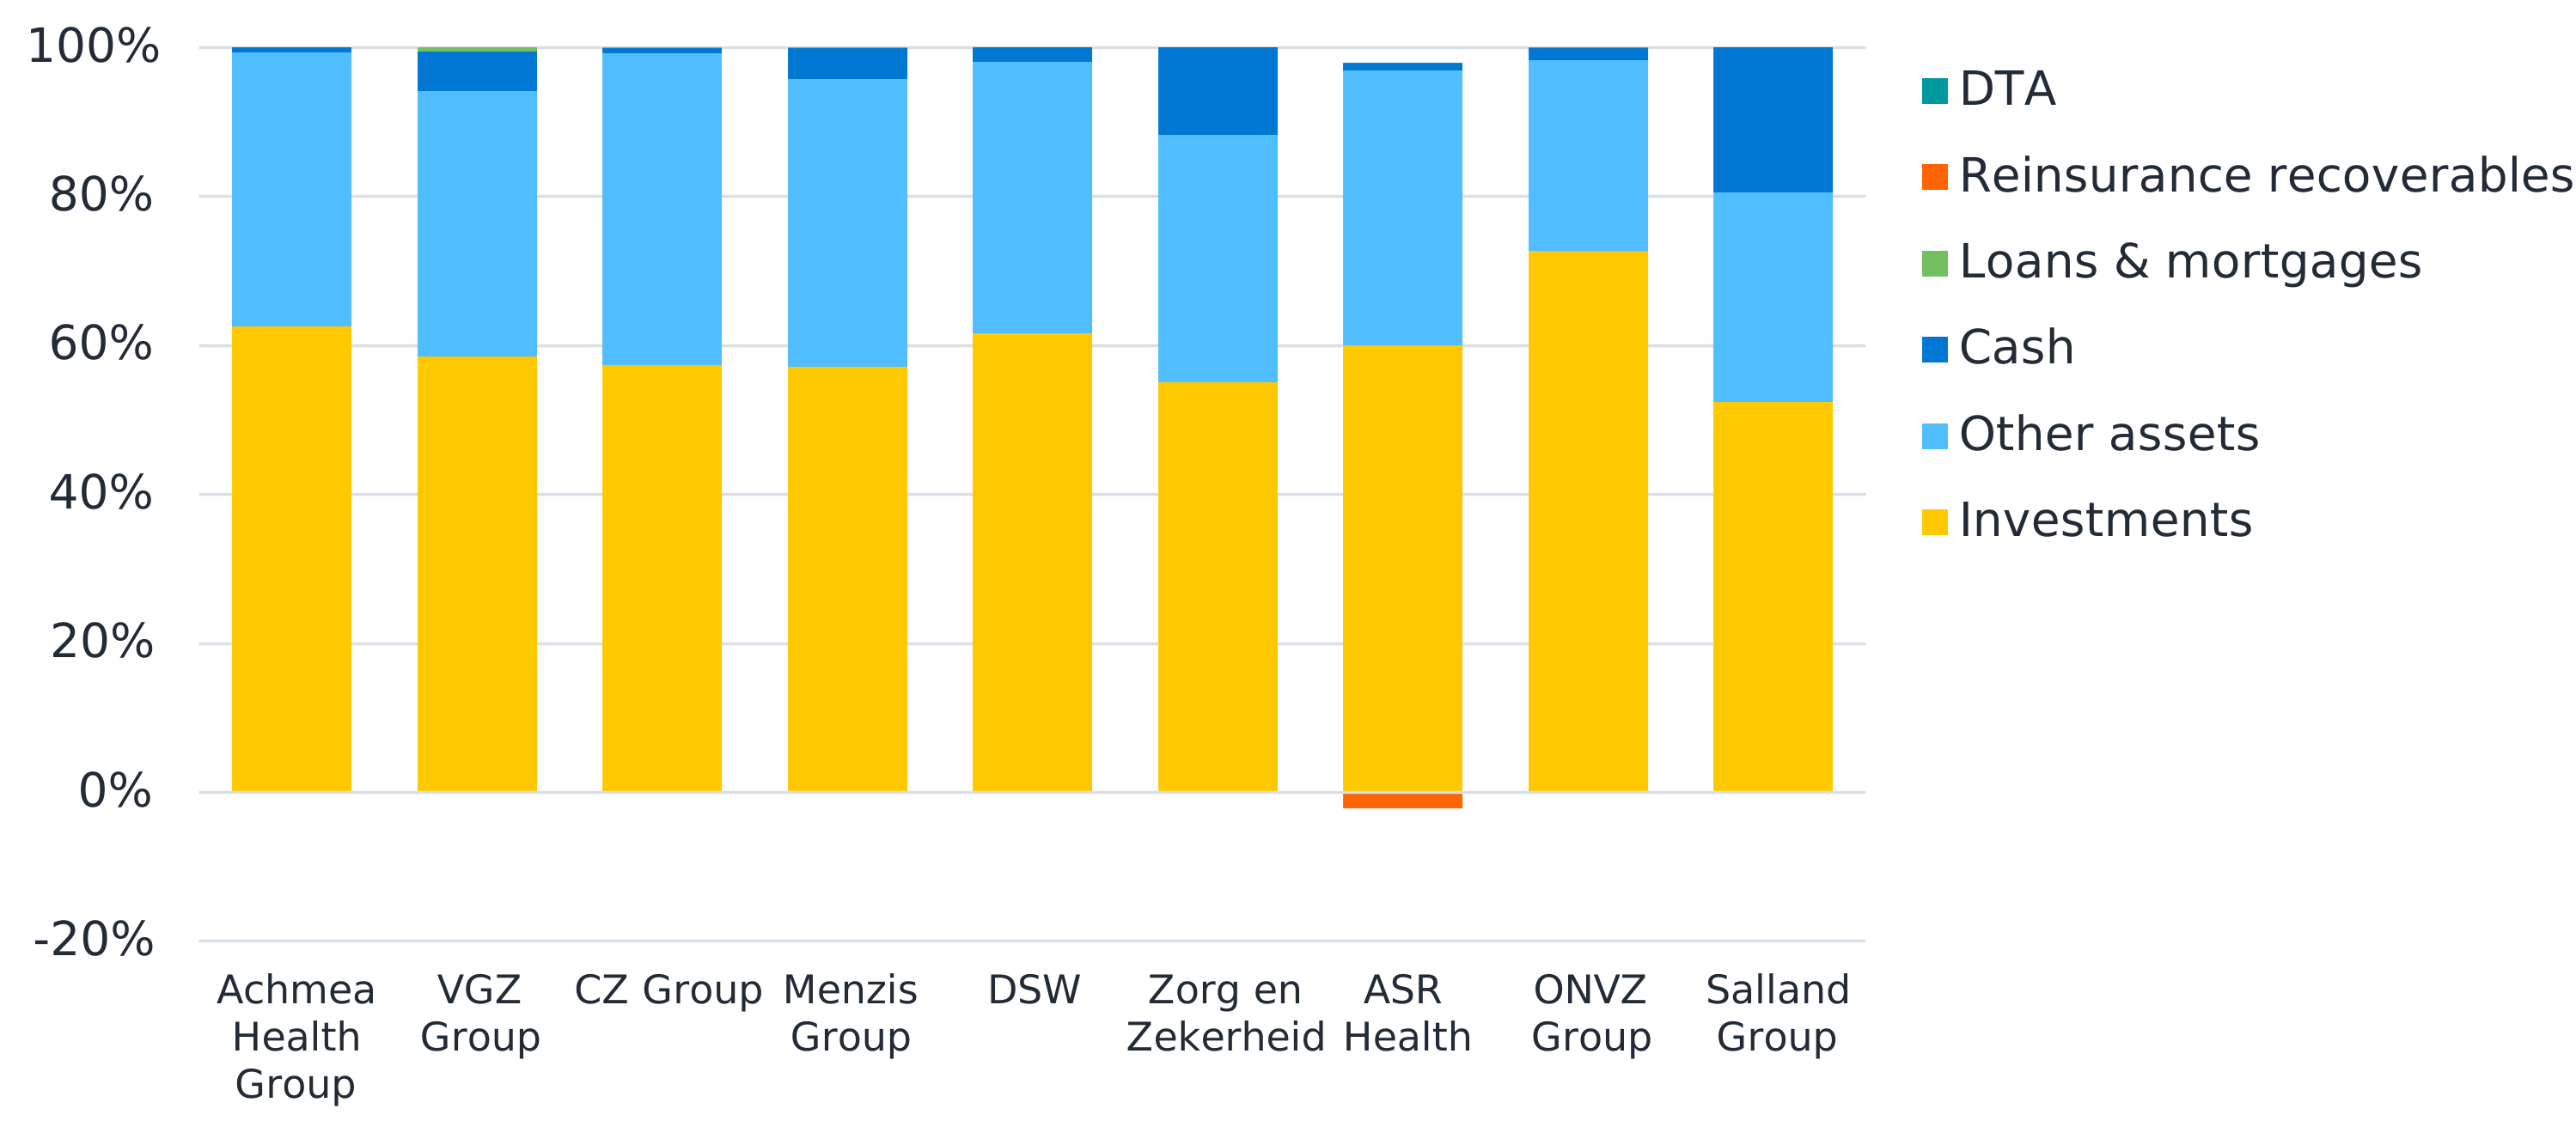
Other assets represent a significant share of health insurers’ balance sheets, particularly for the larger groups. A substantial part of this category consists of receivables from Zorginstituut Nederland related to the Dutch risk-equalisation scheme. The size of these receivables relative to total assets partly reflects insurers’ risk profiles, as ex-ante risk-equalisation contributions are higher for populations with higher expected healthcare costs. The relatively lower share of other assets observed for several smaller insurers may reflect differences in risk-equalisation receivables, although this briefing note does not separately quantify the effect of insured risk profile, timing, and settlement differences.
Investments
Investments accounted for around 60% of total assets in the Dutch health insurance market in 2025. As shown in Figure 12, corporate bonds represented the largest reported investment category, accounting for approximately half of total investments in 2025, followed by collective investment undertakings (CIUs) and government bonds. The overall investment mix has remained relatively stable over the past three years.
Figure 12: Investment mix of the Dutch health insurance market from 2023 to 2025
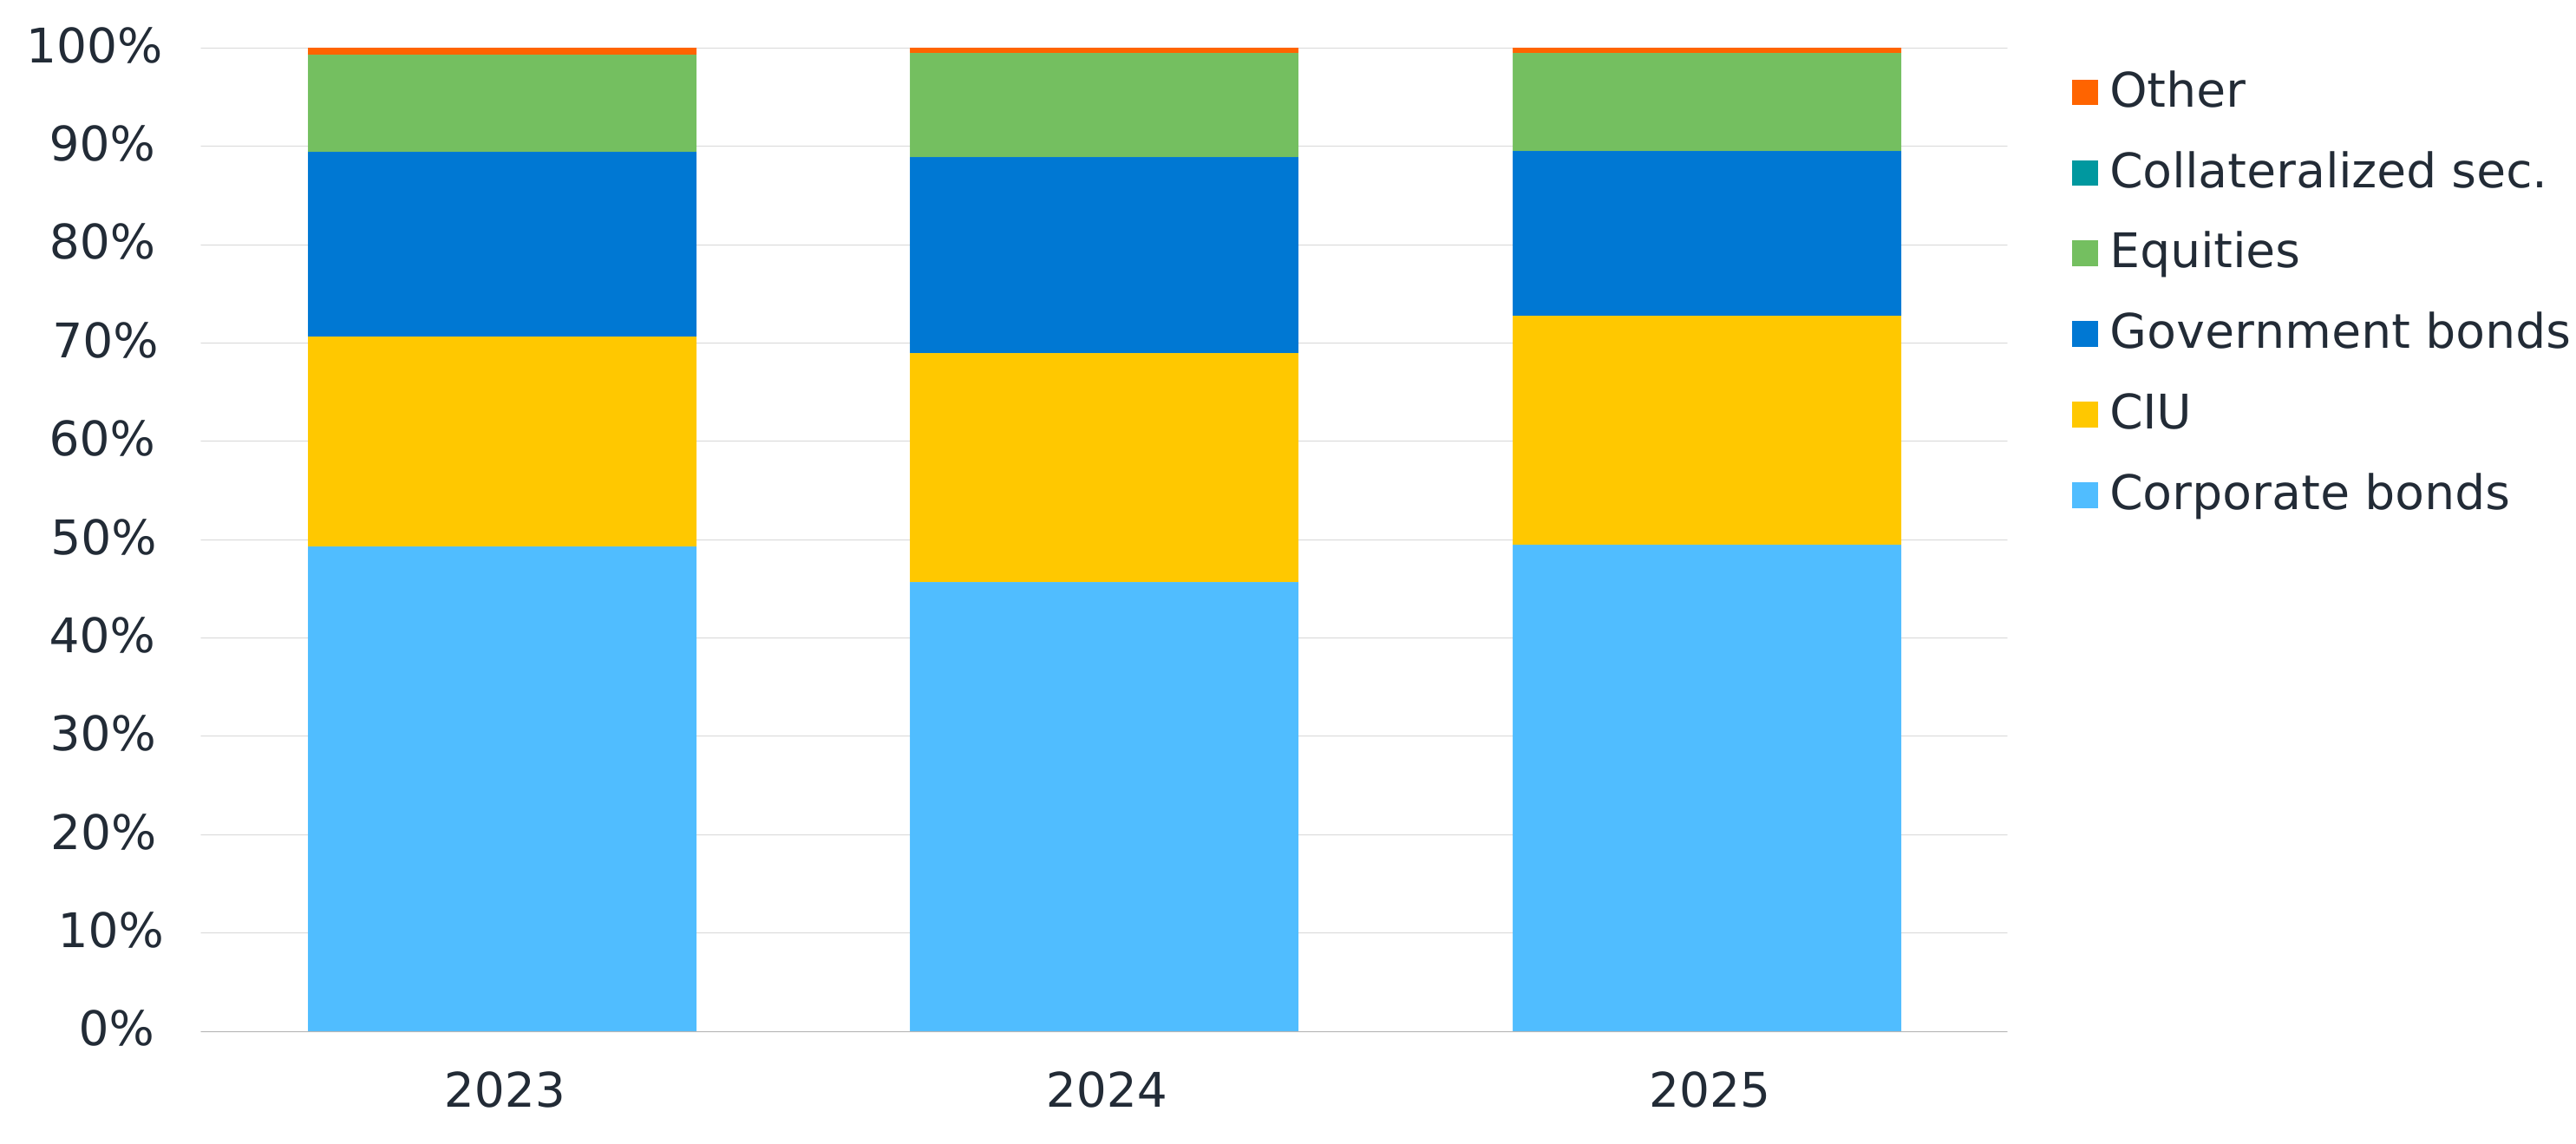
Figure 13 shows the investment mix by health insurer group at year-end 2025, with groups ranked from largest to smallest. Clear differences in reported investment structures can be observed across insurer groups. The four largest insurer groups invest predominantly directly in corporate and government bonds, whereas several smaller groups invest predominantly or entirely through CIUs. CIUs may themselves invest in a range of asset classes, including money market instruments, equities, corporate and government bonds, and mortgages. As the underlying composition of these CIUs cannot be fully determined from publicly available information, the reported investment categories do not provide a complete view of insurers’ ultimate economic exposures.16,17,18
Figure 13: Investment mix by health insurer group at year-end 2025
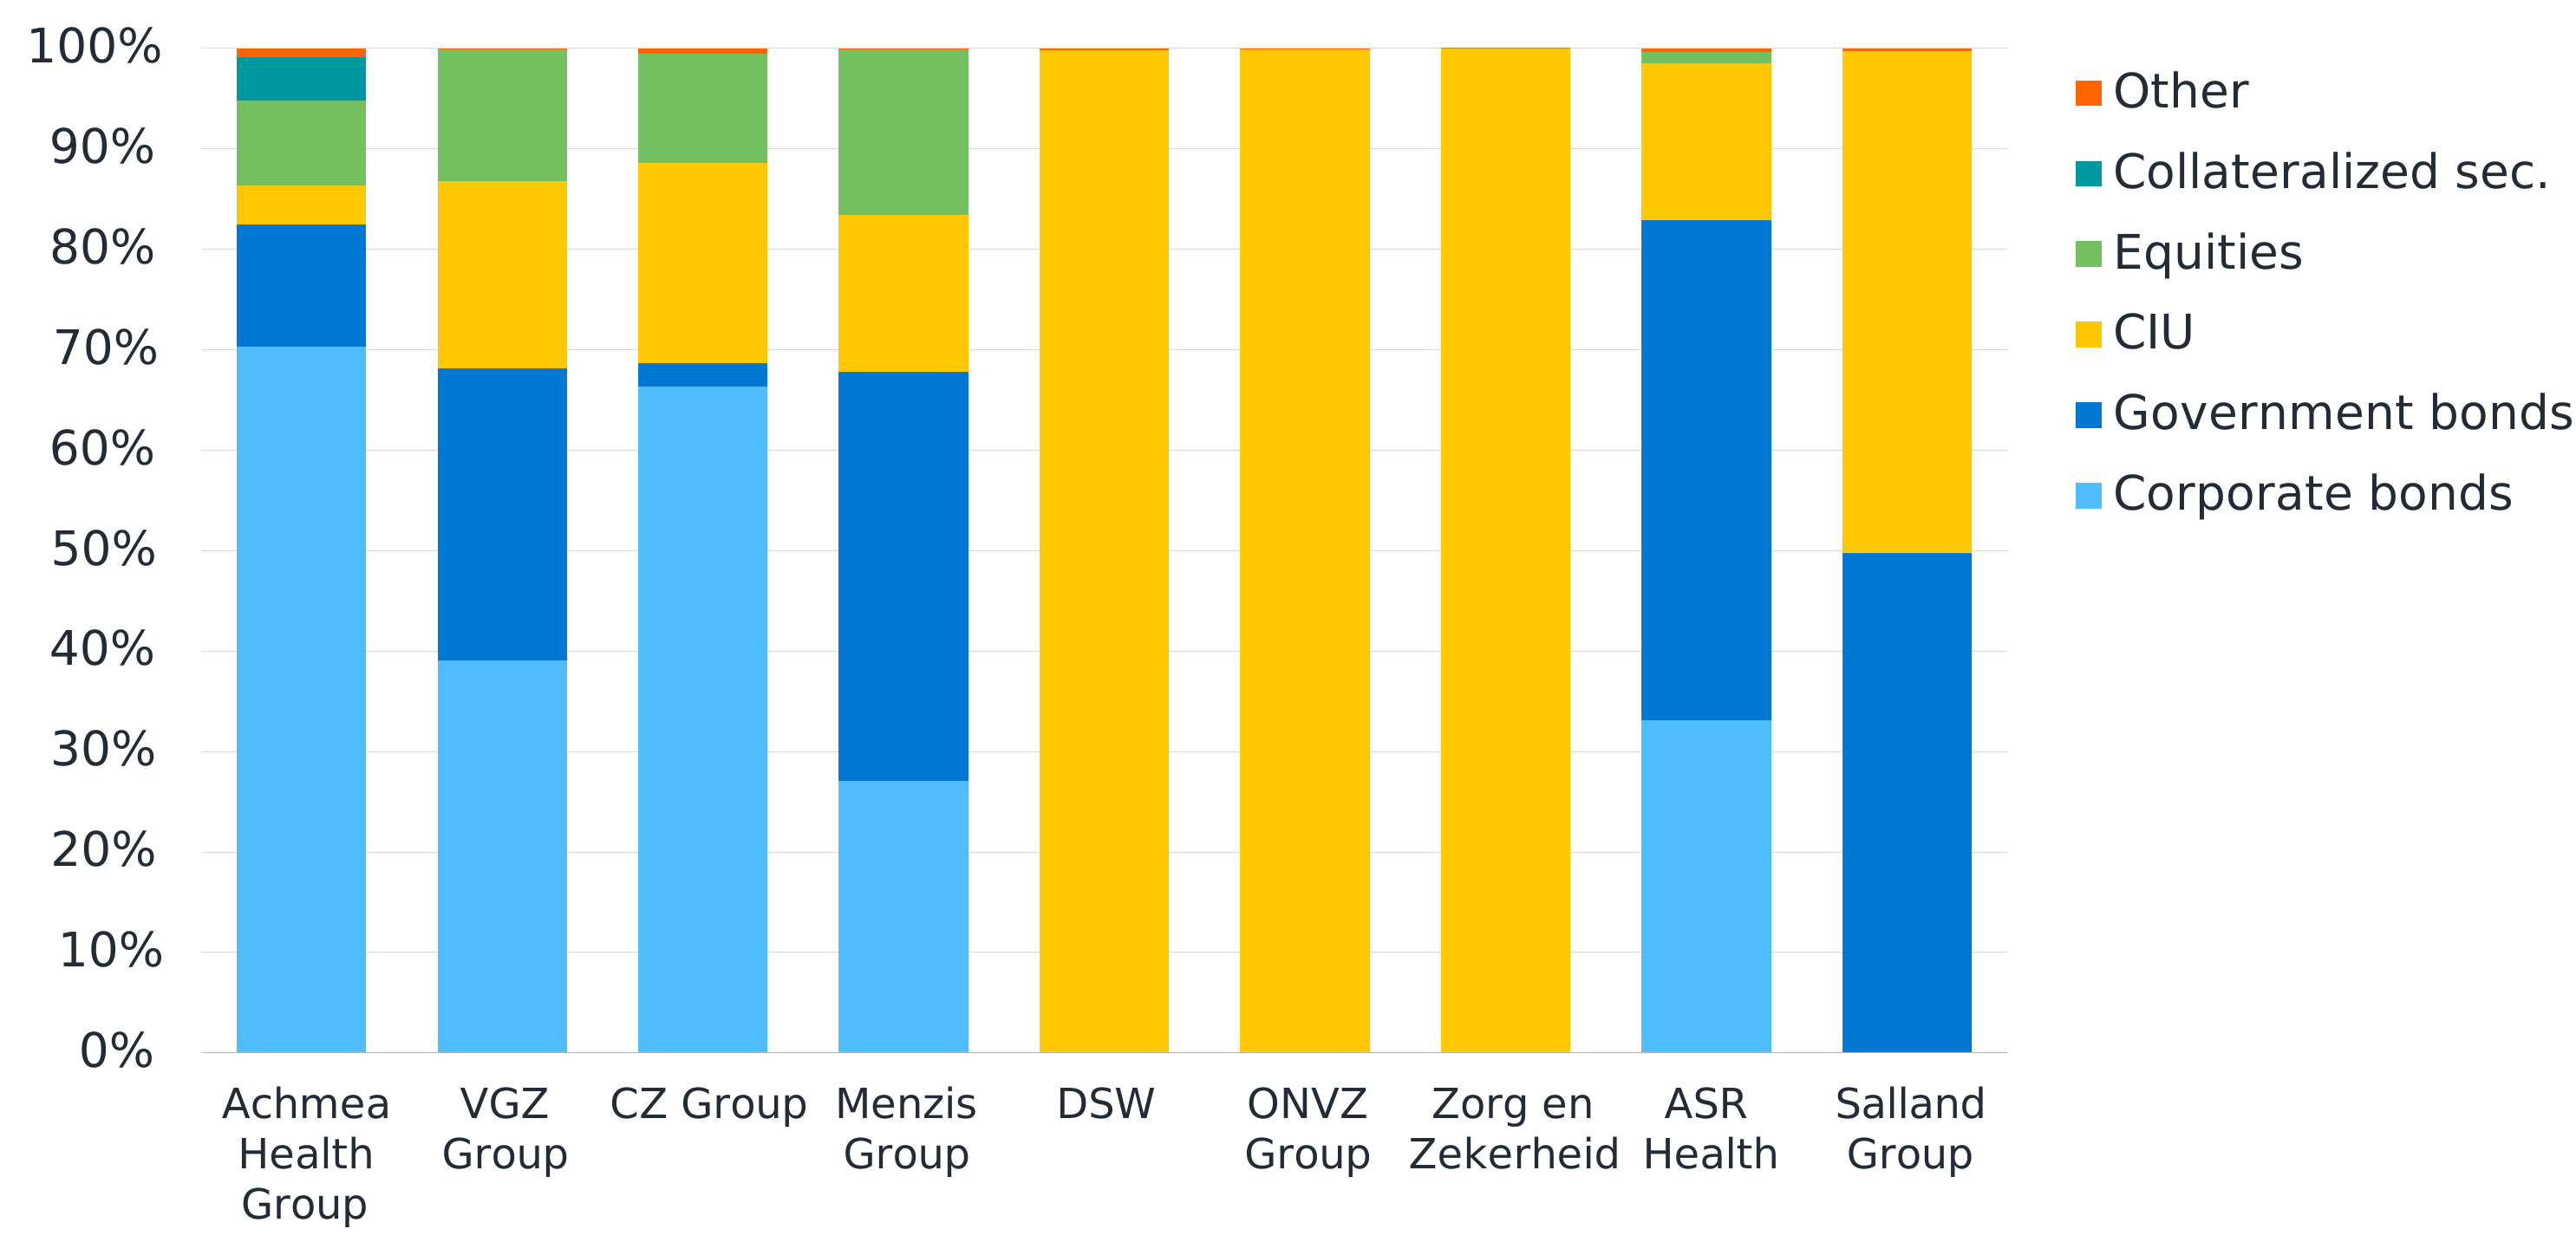
Among the four largest insurer groups, VGZ Group and Menzis Group allocate relatively more to government bonds, while Achmea Health Group and CZ Group have higher direct allocation to corporate bonds. Among the smaller insurer groups, DSW, ONVZ Group, and Zorg en Zekerheid invest almost entirely through CIUs, whereas ASR Health and Salland Group hold substantial direct bond allocations. ASR Health invests directly in both corporate and government bonds, while Salland Group combines government bonds with CIUs.
Direct equity investments are concentrated among the four largest groups. However, given the substantial use of CIUs by smaller insurers, differences in reported direct allocations should not necessarily be interpreted as differences in underlying asset exposure, investment risk, or risk appetite.
What’s next?
Milliman Benelux has developed an interactive application that enables users to compare selected insurer metrics disclosed in QRTs. For more information or access to the application, please visit Milliman Benelux application or contact [email protected].
If you have any questions or comments on the information above or are interested in learning more about Milliman and our services, please contact your Milliman consultant.
Appendix
Figure 14: Considered insurer groups with all underlying solo entities in 2025
Endnotes
1 Eucare is not based in the Netherlands and therefore not included in this analysis.
2 The primary data source for this analysis is Solvency II Wire Data: Dutch health insurer SFCR and QRT disclosures, year-end 2025. Where necessary, data have been supplemented with information from companies’ publicly disclosed SFCRs and QRTs and other regulatory sources.
3 Solvency II Wire. (2026). Solvency II Wire Data: Dutch health insurer SFCR and QRT disclosures, year-end 2025 [Datasets]. Retrieved 6 July 2026 from https://www.solvencyiiwire.com/solvency-ii-wire-data-demo/.
4 This analysis is based primarily on the figures in the disclosed SFCRs at group-entity level. Note that for some insurers, the sum of the underlying solo entities may not equal the reported figures at group-entity level.
5 DSW does not report at the group level; the figures for DSW instead reflect the combined results of OWM DSW Zorgverzekeraar U.A. (DSW (BV)), DSW Ziektekostenverzekeringen N.V. (DSW (AV)), and Stad Holland Zorgverzekeraar Onderlinge Waarborgmaatschappij U.A. (Stad Holland (BV)), as shown in Figure 14 in the Appendix, rather than only the solo entity OWM DSW Zorgverzekeraar U.A. For year-end 2025, the Solvency II data for DSW Ziektekostenverzekeringen N.V. were obtained from data published by De Nederlandsche Bank (DNB) on 14 August 2026, as these data were not available in the Solvency II Wire database, and no publicly available 2025 SFCR was identified for this entity.
6 Zorg en Zekerheid does not report at the group level; the figures for Zorg en Zekerheid refer to the solo entity OWM Zorgverzekeraar Zorg en Zekerheid U.A. (Zorg en Zekerheid (BV+AV)), as shown in Figure 14 in the Appendix.
7 ASR Health does not report at the group level; the figures for ASR Health refer to the combined results of the solo entities ASR Basis Ziektekostenverzekeringen N.V.(ASR (BV)) and ASR Aanvullende Ziektekostenverzekeringen N.V. (ASR (AV)), as shown in Figure 14 in the Appendix.
8 For DSW, the figures reflect the combined results of OWM DSW Zorgverzekeraar U.A., Stad Holland Zorgverzekeraar OWM U.A., and DSW Ziektekostenverzekeringen N.V. The 2024 comparative figures have been restated accordingly to ensure consistency with the 2025 analysis.
9 For this analysis, we have used the figures reported by the underlying solo entities that provide only BV or only AV, excluding the figures reported by the underlying solo entities that provide both BV and AV (referred to as BV+AV) in a calendar year.
10 Vektis. (2026). Zorgthermometer Vektis 2025: Verzekerden in beeld. Retrieved 20 August 2026 from https://www.vektis.nl/nieuws/zorgthermometer-2025.
11 Over the years, there have been shifts in the way solo entities report, whether individually (AV, BV) or jointly (BV+AV). The graph shown in Figure 3 is based on the reporting labels applicable in the calendar year, i.e., AV, BV, or BV+AV.
12 Ministerie van Volksgezondheid, Welzijn en Sport. (30 September 2024). Staatscourant Nr. 31526: (Concept)+Regeling+risicoverevening+2025. Directie Wetgeving en Juridische Zaken. Retrieved 20 August 2026 from https://zoek.officielebekendmakingen.nl/stcrt-2024-31526.html.
13 De Nederlandsche Bank. (November 2016). Beleid inzake kapitaalbeheer – Principes en verwachtingen. Retrieved 20 August 2026 from https://www.dnb.nl/media/zkhdmnpx/beleid-inzake-kapitaalbeheer-principes-en-verwachtingen.pdf.
14 The solo entities of VGZ Group and Zorg en Zekerheid are excluded from Figure 7 because the nature of activities for these entities stems from both the implementation of the Health Insurance Act (BV) and AV health insurance schemes. For the same reason, two solo entities from CZ Group were excluded for the years 2018 and 2019 only. Furthermore, note that the weighted average SCR coverage ratio based on all underlying solo entities is higher than when based on the reported figures for the group entities. This is mainly due to double leverage effects.
15 The labeling of AV for Aanvullende Verzekering and BV for Basisverzekering is based on the situation in each reporting year. For some entities, a switch between AV and BV occurred over time, which has been considered in this analysis.
16 DSW. (2026). Maatschappelijk verslag en jaarrekening 2025. Retrieved 20 August 2026 from https://www.dsw.nl/consumenten/-/media/Documenten/DSW/2025/Maatschappelijk-verslag-2025-DSW.pdf.
17 ONVZ. (2026). Maatschappelijk jaarverslag 2025. Retrieved 20 August 2026 from https://publicaties.onvz.nl/maatschappelijk-jaarverslag-onvz-2025.
18 Zorg en Zekerheid. (2026). Jaarverslag 2025. Retrieved 20 August 2026 from https://www.zorgenzekerheid.nl/contentbeheer/download/jaarverslag-zorg-en-zekerheid-2025.